


USD/JPY Price Forecast: Capped below the 50% retracement of July’s plunge, at 159.50



- USD/JPY maintains its positive trend intact, yet with 159.50 resistance holding bulls.
- US CPI data heightens expectations of a steady Fed monetary policy in September.
- US Dollar's downside attempts remain limited above 158.50 so far.
The US Dollar (USD) remains practically flat against the Japanese Yen (JPY) on Thursday, as fading hopes of a Federal Reserve (Fed) interest rate hike in September have undermined speculative demand for the Greenback. The USD/JPY pair maintains its near-term upside trend intact, yet with bulls capped below the 50% Fibonacci retracement of July’s sell-off, at the 159.50 area.
Analysts at TD Securities highlight that "near-term inflation risks still skew higher, but Fed can be patient," noting that "markets moderately lowered hike pricing, but we are not in the clear just yet."
In the currency space, TD observes that "USD traded weaker as in-line CPI release still preserved bearish USD momentum," underscoring that the latest data have done little to disrupt the prevailing negative bias toward the Dollar.
Technical Analysis: US Dollar remains bullish but momentum fades
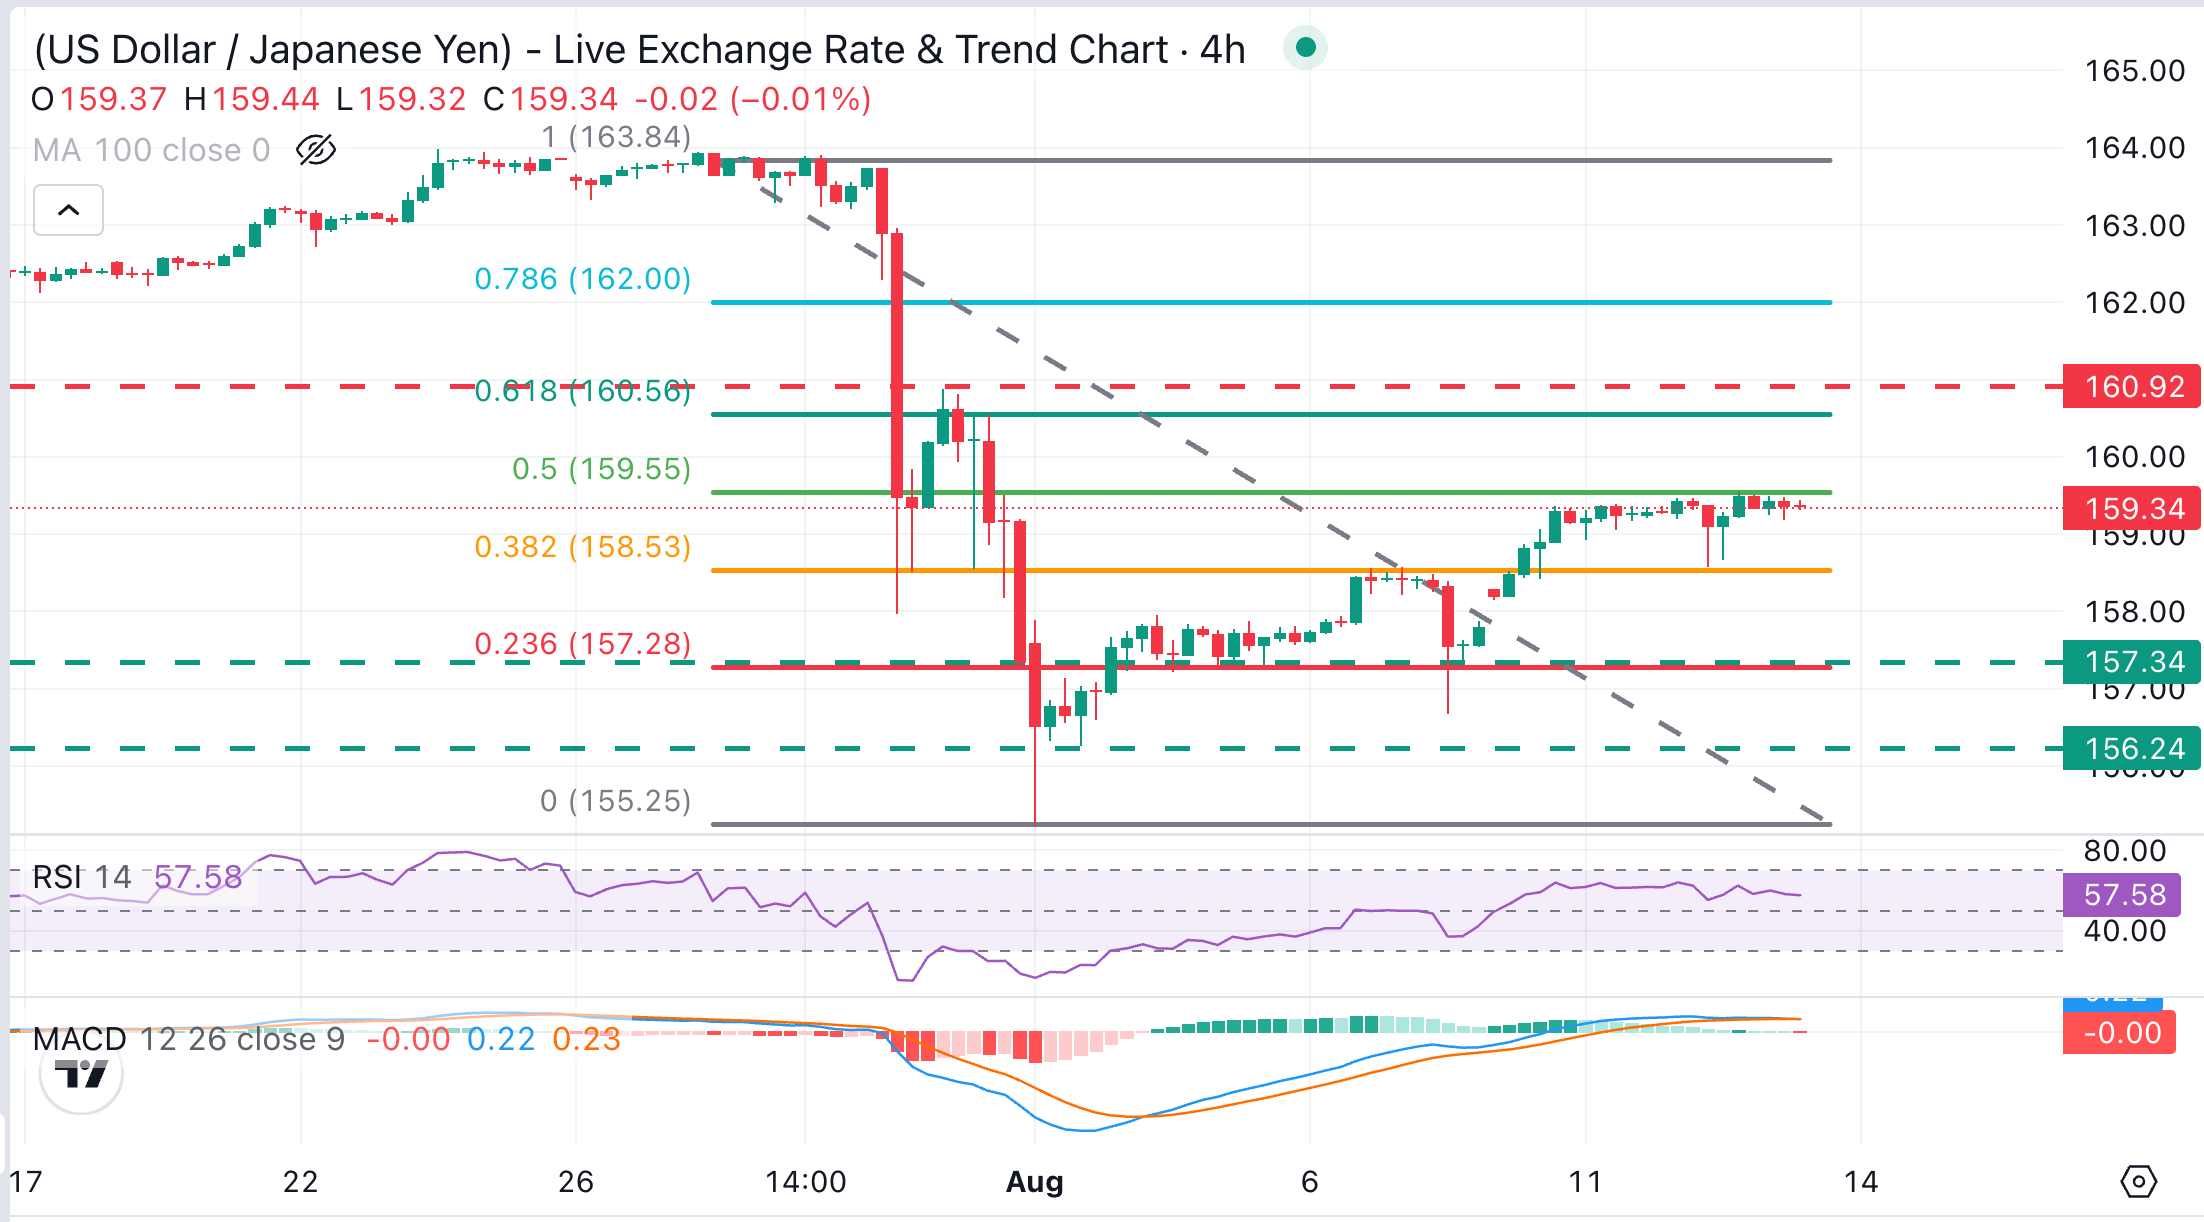
From a technical perspective, USD/JPY holds a bullish near-term bias, although intra-day momentum indicators reflect fading upside traction. The 4-hour Relative Strength Index (14) at 57.22 leans constructive, but the Moving Average Convergence Divergence (MACD) indicator is flattening near the zero line, suggesting that buyers might be starting to give up.
The 50% Fibonacci retracement of late July's intervention-induced decline, at the 159.50 area, is capping upside attempts for now, closing the path towards the 160.00 psychological area, considered a line in the sand for Tokyo authorities, and the July 31 highs, near 160.90.
On the downside, the 38.2% Fibonacci retracement of the latest upswing at 158.53 is containing downside attempts for now. Further down, the August 4 and 5 lows, near 157.30, and the cluster around the 23.6% retracement at 157.28 are likely to challenge bears.
(The technical analysis of this story was written with the help of an AI tool. Know more.)
US Dollar Price Today
The table below shows the percentage change of US Dollar (USD) against listed major currencies today. US Dollar was the strongest against the New Zealand Dollar.
| USD | EUR | GBP | JPY | CAD | AUD | NZD | CHF | |
|---|---|---|---|---|---|---|---|---|
| USD | -0.09% | 0.02% | -0.06% | 0.01% | 0.11% | 0.27% | -0.22% | |
| EUR | 0.09% | 0.12% | 0.02% | 0.07% | 0.22% | 0.35% | -0.12% | |
| GBP | -0.02% | -0.12% | -0.06% | 0.00% | 0.11% | 0.24% | -0.25% | |
| JPY | 0.06% | -0.02% | 0.06% | 0.05% | 0.18% | 0.28% | -0.18% | |
| CAD | -0.01% | -0.07% | 0.00% | -0.05% | 0.12% | 0.26% | -0.23% | |
| AUD | -0.11% | -0.22% | -0.11% | -0.18% | -0.12% | 0.14% | -0.34% | |
| NZD | -0.27% | -0.35% | -0.24% | -0.28% | -0.26% | -0.14% | -0.46% | |
| CHF | 0.22% | 0.12% | 0.25% | 0.18% | 0.23% | 0.34% | 0.46% |
The heat map shows percentage changes of major currencies against each other. The base currency is picked from the left column, while the quote currency is picked from the top row. For example, if you pick the US Dollar from the left column and move along the horizontal line to the Japanese Yen, the percentage change displayed in the box will represent USD (base)/JPY (quote).
Recommended Articles










Comments (0)
Click the $ button, enter the symbol, and select to link a stock, ETF, or other ticker.