


EUR/USD Price Forecast: 100-day SMA caps Euro recovery



- EUR/USD stalls near 100-day SMA after reclaiming 50-day average.
- Bullish RSI keeps upside bias alive despite Monday’s pullback.
- Break above 1.1600 exposes 200-day SMA and 1.1700.
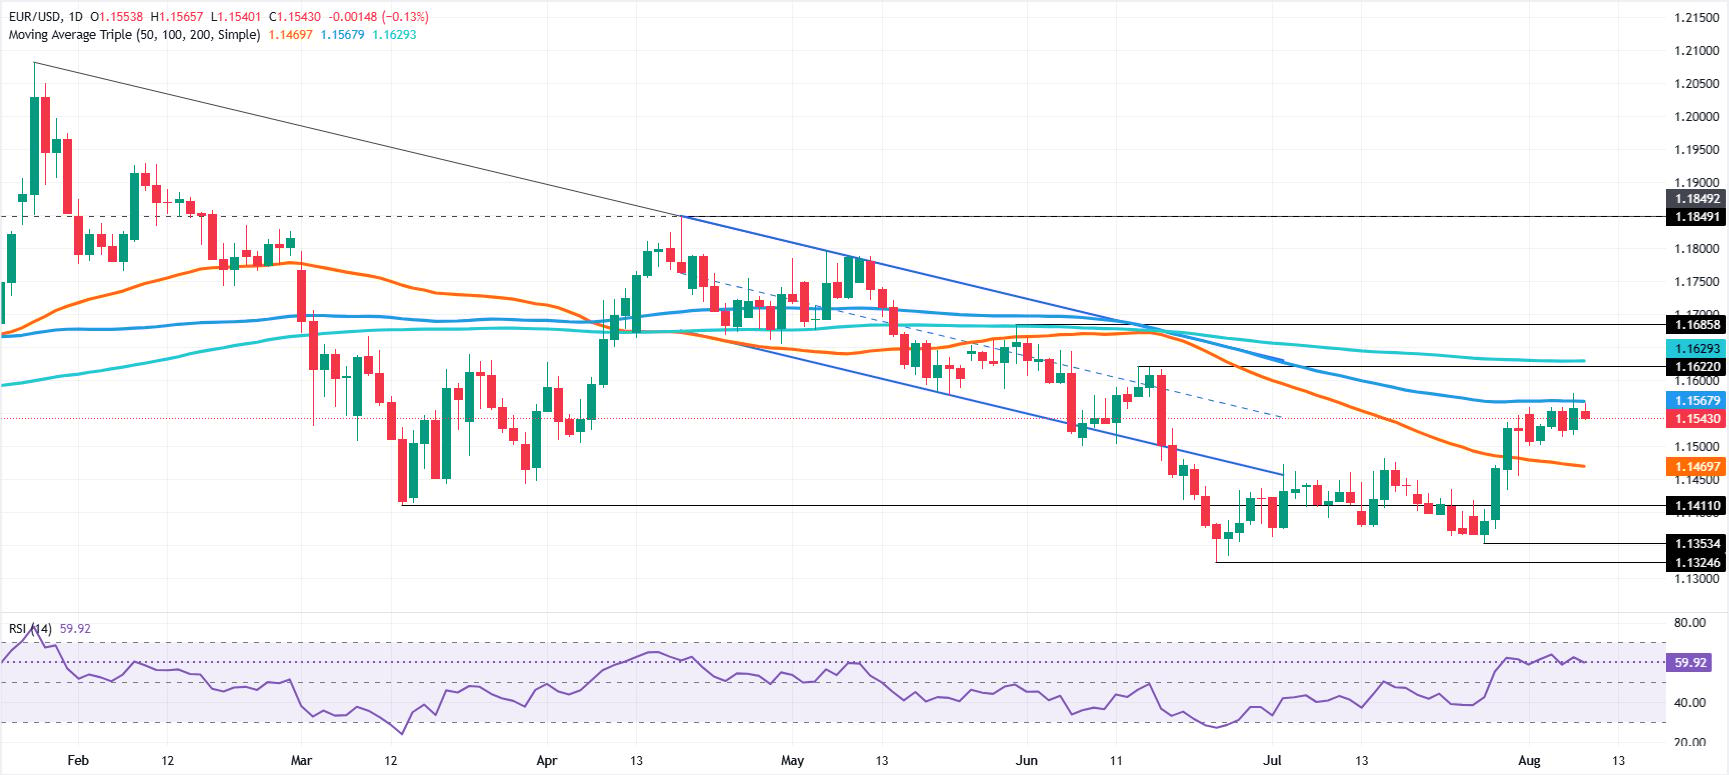
The Euro is poised to end Monday’s session with losses of about 0.13% against the Greenback, as recent news points to a delay in talks between the US and Iran, while, from a technical perspective, EUR/USD stalled at the 100-day Simple Moving Average (SMA) near 1.1568.
EUR/USD Price Forecast: Technical outlook
Overall, the EUR/USD is poised to consolidate further, though it is slightly tilted to the upside after buyers reclaimed the 50-day SMA. Momentum confirms the short-term upward bias, as indicated by the Relative Strength Index (RSI).
That said, the first resistance for EUR/USD is the 100-day SMA. A breach of the latter will expose 1.1600, followed by the 200-day SMA at 1.1629. Once those two levels are removed, the next target is the 1.1700 psychological figure.
On the flip side, if EUR/USD drops below 1.1500, a pullback towards the 50-day SMA at 1.1469 is on the cards. Below, the next area of interest is the 1.1400 mark, followed by the July 28 swing low of 1.1353.
EUR/USD Price Chart – Daily
Euro Price This week
The table below shows the percentage change of Euro (EUR) against listed major currencies this week. Euro was the strongest against the New Zealand Dollar.
| USD | EUR | GBP | JPY | CAD | AUD | NZD | CHF | |
|---|---|---|---|---|---|---|---|---|
| USD | 0.04% | 0.00% | 0.02% | 0.00% | 0.00% | -0.00% | -0.04% | |
| EUR | -0.04% | 0.01% | 0.00% | -0.00% | -0.02% | 0.02% | -0.04% | |
| GBP | -0.00% | -0.01% | 0.00% | 0.02% | 0.00% | 0.00% | 0.00% | |
| JPY | -0.02% | 0.00% | 0.00% | -0.03% | -0.00% | 0.37% | -0.00% | |
| CAD | -0.01% | 0.00% | -0.02% | 0.03% | 0.03% | 0.38% | 0.01% | |
| AUD | 0.00% | 0.02% | 0.00% | 0.00% | -0.03% | 0.00% | 0.03% | |
| NZD | 0.00% | -0.02% | -0.01% | -0.37% | -0.38% | -0.01% | 0.03% | |
| CHF | 0.04% | 0.04% | -0.00% | 0.00% | -0.01% | -0.03% | -0.03% |
The heat map shows percentage changes of major currencies against each other. The base currency is picked from the left column, while the quote currency is picked from the top row. For example, if you pick the Euro from the left column and move along the horizontal line to the US Dollar, the percentage change displayed in the box will represent EUR (base)/USD (quote).
Recommended Articles








Comments (0)
Click the $ button, enter the symbol, and select to link a stock, ETF, or other ticker.