


EUR/GBP Price Forecast: Holding below 0.8580 with dips limited so far



- EUR/GBP drops down to 0.8575 on Thursday after being rejected at the 0.8580 area.
- Lower oil prices and positive Eurozone data are keeping the Euro downside attempts limited.
- Failure to extend gains above the late-July top, at 0.8586, might give bears fresh hopes.
The Euro (EUR) nudges lower against the British Pound (GBP) on Thursday, following a three-day rally. The EUR/GBP remains capped below the late-July top of 0.8586, trading at 0.8575 at the time of writing, yet with downside attempts subdued so far.
Eurozone data was supportive on Thursday, as German Factory Orders beat expectations with a 3.1% increase in June, largely exceeding the 0.3% market forecast, and a downwardly revised 0.3% reading in May.
Regarding the Pound, FX strategists at Rabobank argue that “a re-pricing in policy expectations towards steady policy from the BoE this year combined with the prospect of nervousness ahead of the October budget suggests scope for downside pressure on the pound as the summer draws to a close.”
In this context, Rabobank continues to see value in the cross, stating that “we favour buying EUR/GBP on dips to the 0.8550 area,” and adding that “a break above the recent high in the 0.8588 region could increase upside potential.”
Technical Analysis: Failure to break 0.8586 might encourage bears
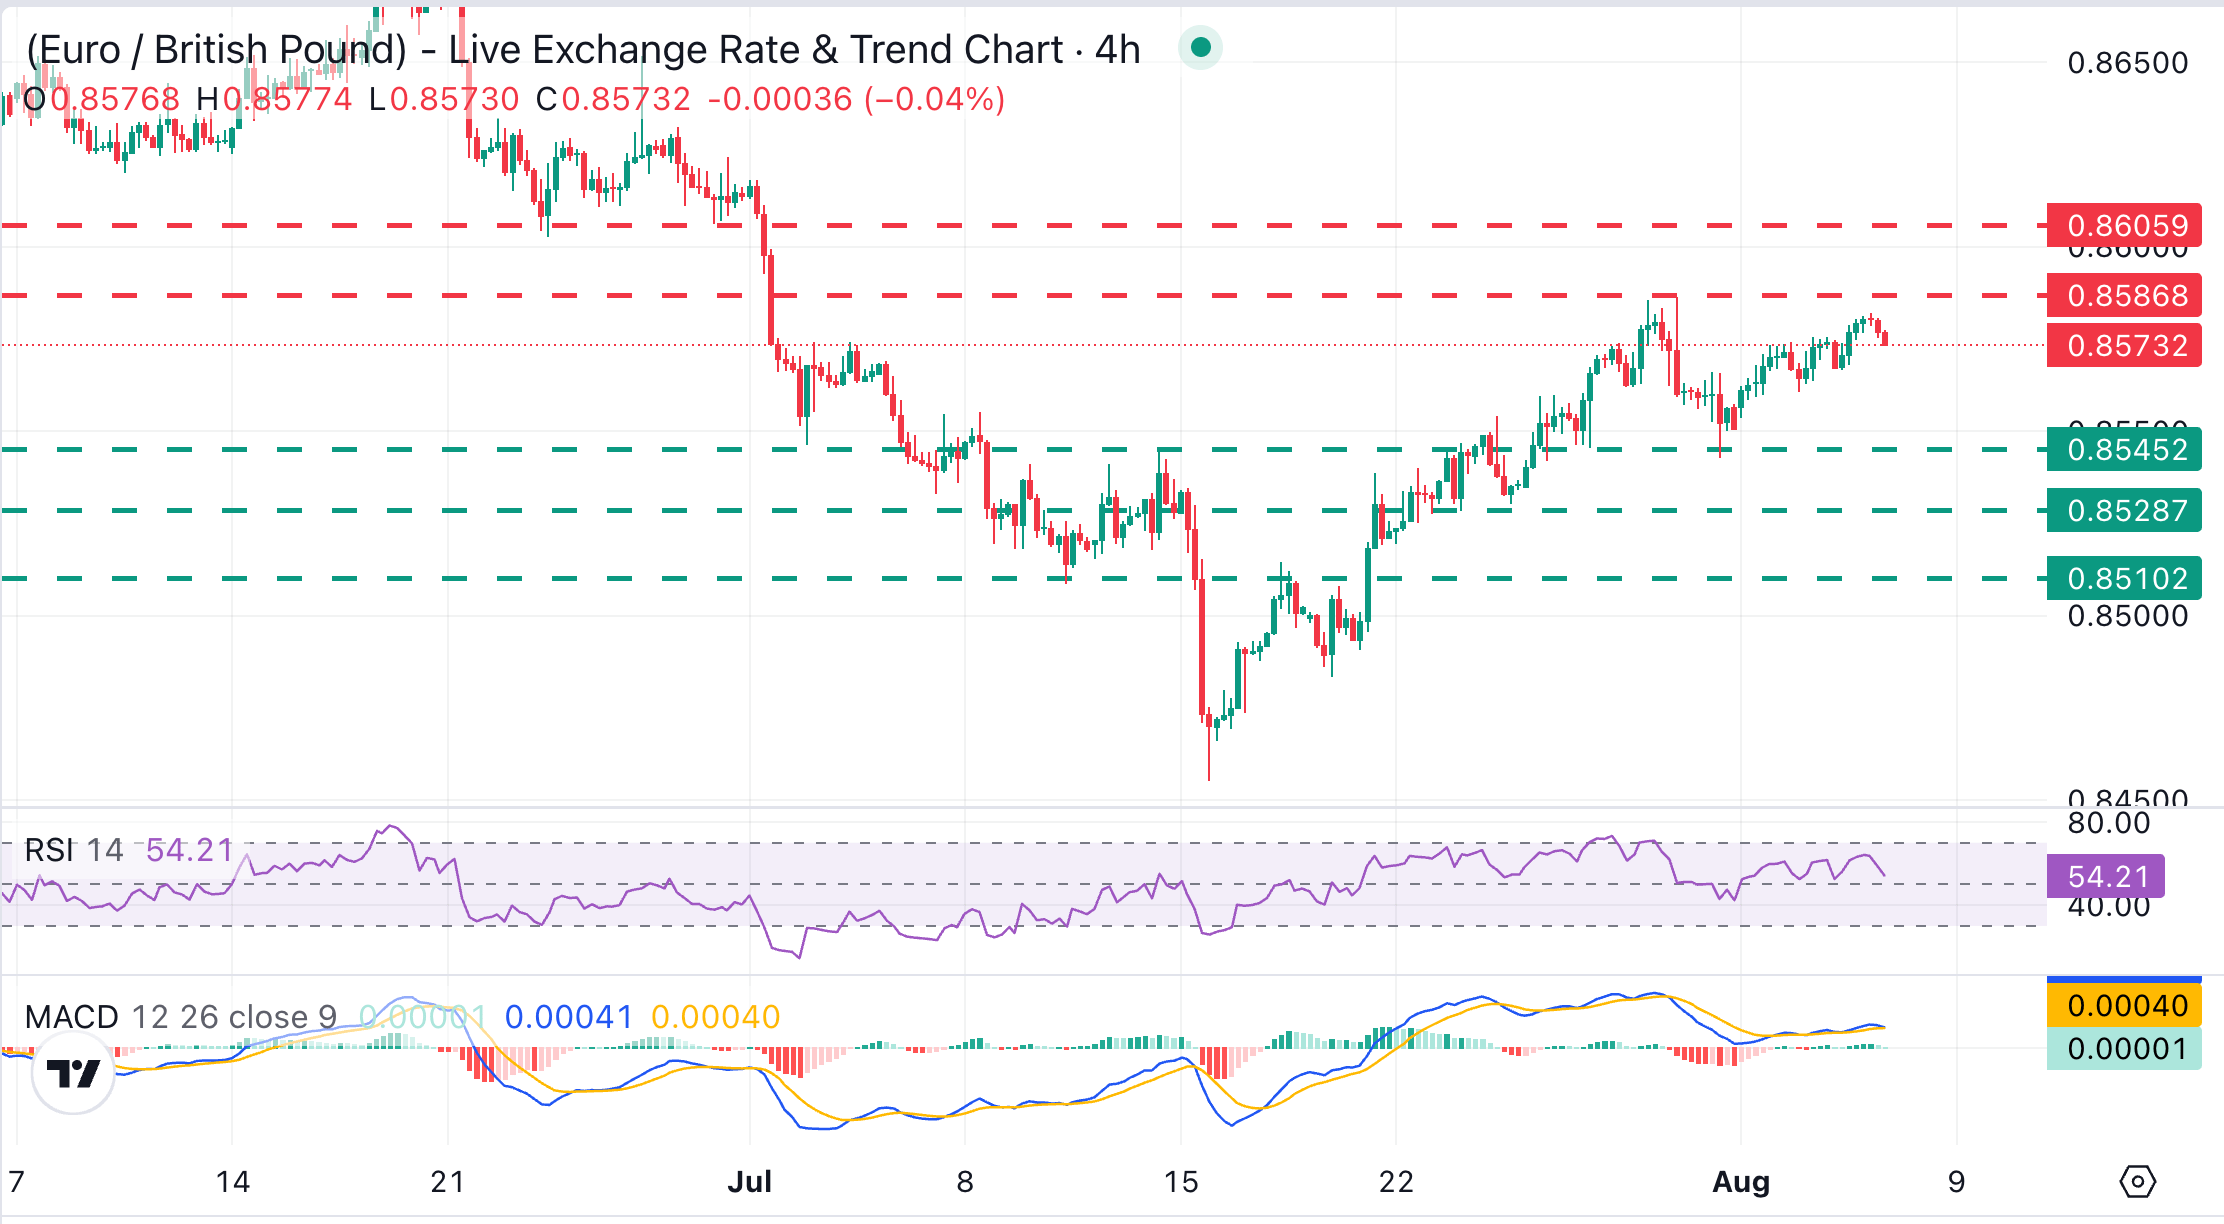
The technical picture shows the EUR/GBP pair trading at 0.8576, with momentum indicators highlighting weaker bullish traction. The Relative Strength Index (14) is trending towards the 50 midline, while the Moving Average Convergence Divergence (MACD) indicator hovers around zero, suggesting that bullish momentum is present but tentative.
Bulls need to break the mentioned 0.8586 resistance area level (July 29, 30 highs) to confirm the positive trend and target late June lows at the 0.8605 area. Failure to do so might give fresh hopes for bears to break the August 4 and 5 lows in the 0.8560-0.8565 area and aim for the July 31 low, near 0.8540, which will be the neckline of a double top pattern.
On the downside, immediate support is seen at 0.8548, followed by additional underlying demand at 0.8529 and 0.8510, with deeper structural levels resting at 0.8419 and 0.8327. On the topside, initial resistance aligns at 0.8587, ahead of 0.8606; a sustained break above these caps would open the way toward 0.8730 and 0.8741, with higher hurdles at 0.8790 and 0.8863 likely to limit any extended advance.
(The technical analysis of this story was written with the help of an AI tool. Know more.)
Recommended Articles










Comments (0)
Click the $ button, enter the symbol, and select to link a stock, ETF, or other ticker.