


GBP/JPY Price Forecast: Bears test 200-day SMA after sharp selloff



- GBP/JPY edges higher as the Japanese Yen loses ground following its recent sharp rally.
- MUFG says coordinated intervention may support the Yen temporarily but cannot reverse its broader weakness without a change in fundamentals.
- The cross holds below the 100-day SMA and tests the 200-day SMA, keeping the near-term outlook bearish.
GBP/JPY on Tuesday as the Japanese Yen (JPY) gives back part of its recent rally, which was driven by coordinated intervention from Tokyo and Washington.
At the time of writing, the cross trades around 211.55, up 0.20% on the day.
Yen support from US intervention seen as limited and time-buying
Analysts at MUFG/BTMU argue that the recent bout of joint FX intervention offers only partial and temporary relief for the Yen. They stress that, "on balance, we expect US intervention to support the yen to remain relatively small in scale," even if coordinated action with Japan helps steady the currency in the near term. In their view, "while joint intervention may prove more effective at helping to provide support for the yen in the near-term, we still believe that it can only buy time." MUFG/BTMU conclude that, ultimately, "there will need to be a change in fundamentals as well to encourage a sustainable reversal of the yen weakening trend that has been in place over the last five years."
Despite Tuesday’s rebound, the near-term technical picture for GBP/JPY has turned bearish. The recent sell-off pushed the cross decisively below the 100-day Simple Moving Average (SMA) for the first time since April 2025, with the pair now testing the 200-day SMA.
Technical analysis
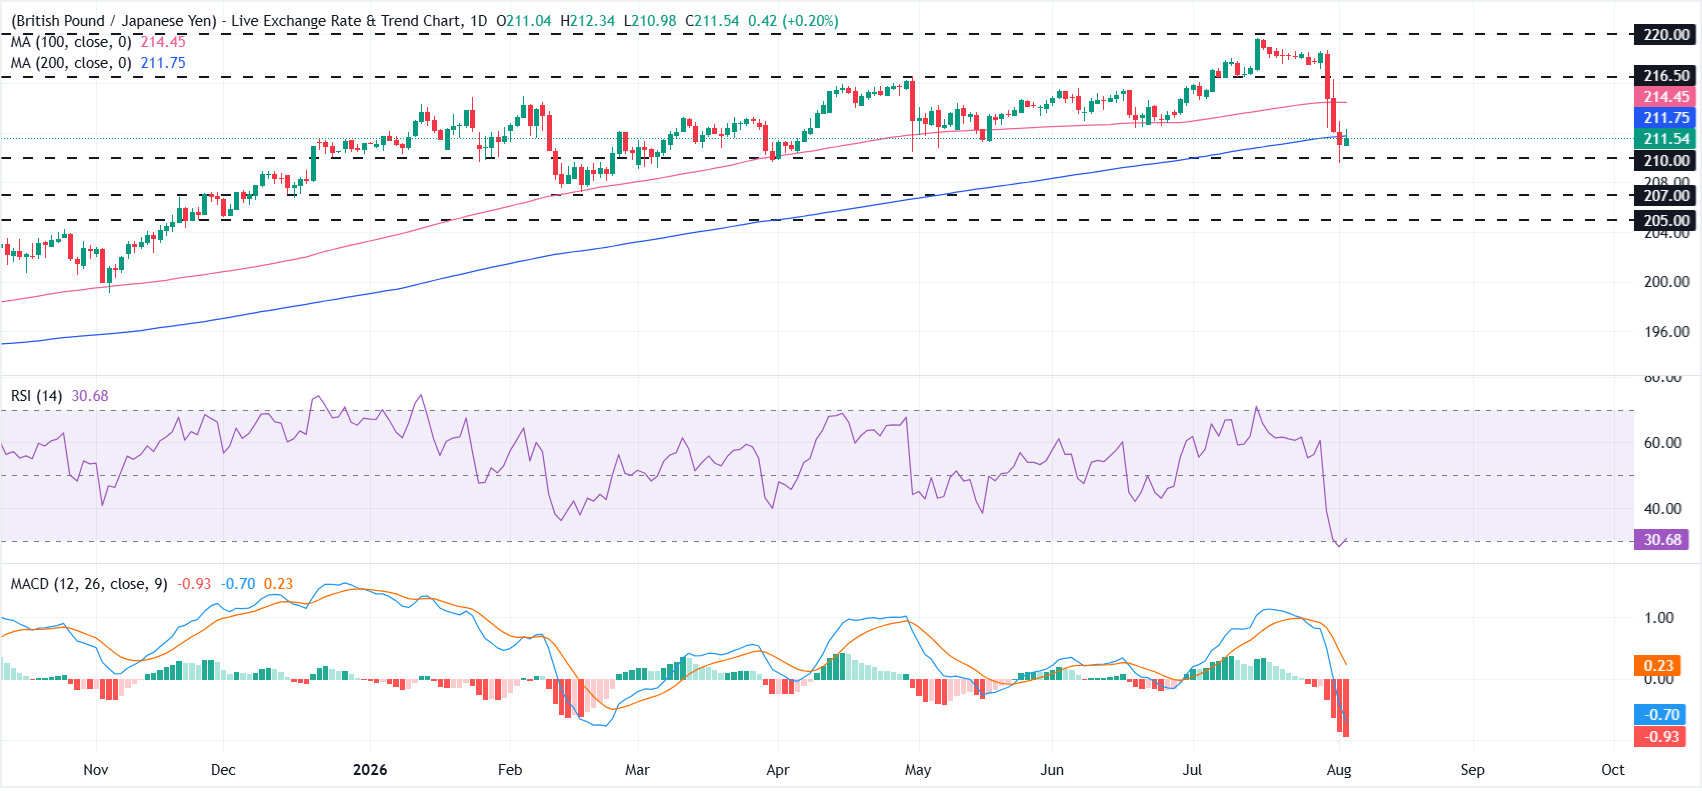
On the daily chart, GBP/JPY trades below the 100-day Simple Moving Average (SMA) at 214.45 and hovers around the 200-day SMA at 211.75, keeping the near-term bias tilted to the downside.
The Relative Strength Index (RSI) near 30 hints at oversold conditions and the Moving Average Convergence Divergence (MACD) remains deeply negative, reinforcing selling pressure.
On the topside, initial resistance is located at the 100-day SMA at 214.45, followed by the horizontal barrier at 216.50, with a stronger cap emerging near 220.
On the downside, the 200-day SMA at 211.75 marks first support ahead of the 210 level, with deeper floors at 207 and 205, where bears could start to lose momentum if the RSI slips further into oversold territory.
(The technical analysis of this story was written with the help of an AI tool. Know more.)
Japanese Yen Price Today
The table below shows the percentage change of Japanese Yen (JPY) against listed major currencies today. Japanese Yen was the strongest against the Canadian Dollar.
| USD | EUR | GBP | JPY | CAD | AUD | NZD | CHF | |
|---|---|---|---|---|---|---|---|---|
| USD | -0.06% | -0.08% | 0.14% | 0.10% | -0.44% | -0.22% | -0.15% | |
| EUR | 0.06% | -0.04% | 0.22% | 0.15% | -0.41% | -0.19% | -0.08% | |
| GBP | 0.08% | 0.04% | 0.28% | 0.21% | -0.35% | -0.13% | -0.04% | |
| JPY | -0.14% | -0.22% | -0.28% | -0.06% | -0.60% | -0.41% | -0.19% | |
| CAD | -0.10% | -0.15% | -0.21% | 0.06% | -0.54% | -0.34% | -0.24% | |
| AUD | 0.44% | 0.41% | 0.35% | 0.60% | 0.54% | 0.22% | 0.30% | |
| NZD | 0.22% | 0.19% | 0.13% | 0.41% | 0.34% | -0.22% | 0.10% | |
| CHF | 0.15% | 0.08% | 0.04% | 0.19% | 0.24% | -0.30% | -0.10% |
The heat map shows percentage changes of major currencies against each other. The base currency is picked from the left column, while the quote currency is picked from the top row. For example, if you pick the Japanese Yen from the left column and move along the horizontal line to the US Dollar, the percentage change displayed in the box will represent JPY (base)/USD (quote).
Recommended Articles










Comments (0)
Click the $ button, enter the symbol, and select to link a stock, ETF, or other ticker.