


EUR/JPY Price Forecast: Tumbles below 100-day SMA, eyes on 183



- EUR/JPY breaks below 100-day SMA, confirming bearish technical shift.
- RSI turns lower as sellers target 183.00 support zone.
- Break below 183.00 exposes 200-day SMA and 180.81 low.
The Euro retreated on Wednesday against the Japanese Yen, down 0.08% amid growing speculation that Japanese authorities may intervene in the foreign exchange markets and also inflation in the producer side in Japan, exceeded estimates above the 3% threshold. The EUR/JPY cross-pair trades at 183.70 after reaching a daily high of 183.92.
EUR/JPY Price Forecast: Technical outlook
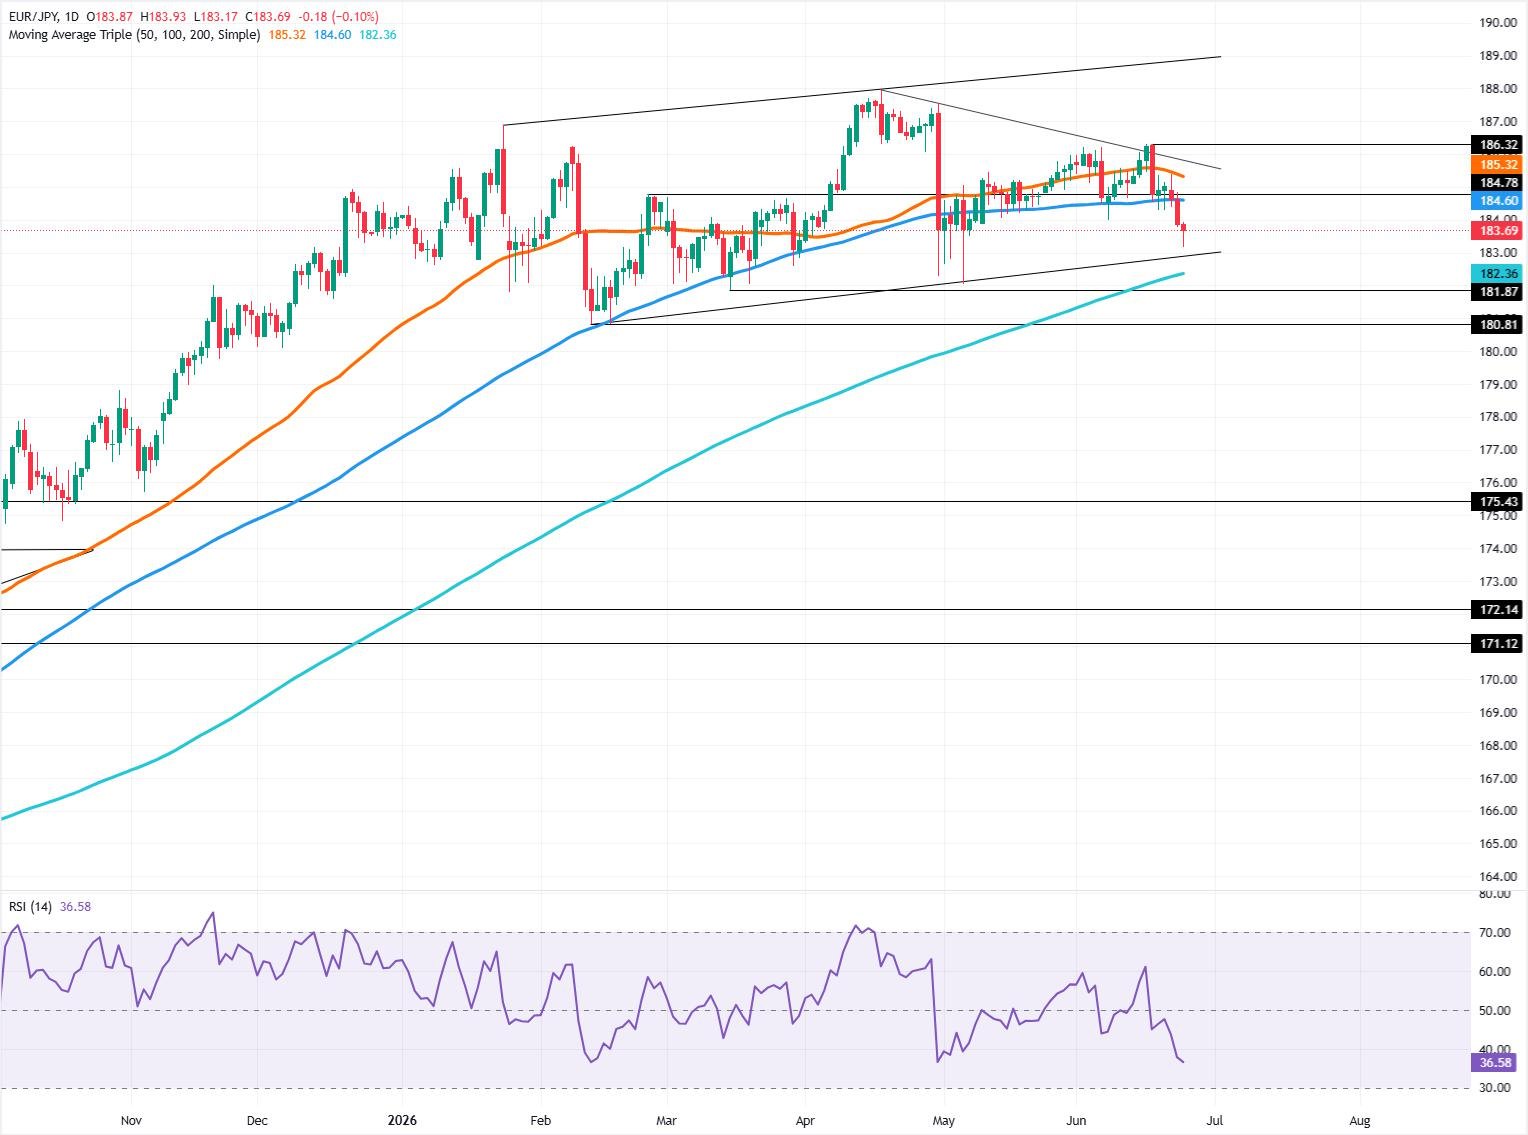
Price action shows that bears are in charge. The EUR/JPY fell from around weekly highs near the 50-day SMA at 185.32 to current spot prices, diving below the 100-day SMA at 184.60, which exacerbated the drop below 184.00.
Momentum clearly shifted bearish as depicted in the Relative Strength Index (RSI). If the EUR/JPY dives below 183.00, it would expose the 200-day SMA at 182.36. Once cleared, the next area of interest would be the latest cycle low of 180.81, the February 12 swing low.
Upwards, the chances are capped due to intervention fears. If EUR/JPY clears 184.00, it will expose the 100-day SMA, followed by 185.00. Above this area sits the 50-day SMA, followed by the June 17 daily high of 186.32.
EUR/JPY Price Chart – Daily
Japanese Yen Price Today
The table below shows the percentage change of Japanese Yen (JPY) against listed major currencies today. Japanese Yen was the strongest against the New Zealand Dollar.
| USD | EUR | GBP | JPY | CAD | AUD | NZD | CHF | |
|---|---|---|---|---|---|---|---|---|
| USD | 0.22% | 0.29% | 0.11% | 0.19% | 0.28% | 0.41% | 0.32% | |
| EUR | -0.22% | 0.08% | -0.13% | -0.08% | 0.07% | 0.17% | 0.11% | |
| GBP | -0.29% | -0.08% | -0.19% | -0.15% | -0.01% | 0.09% | 0.04% | |
| JPY | -0.11% | 0.13% | 0.19% | 0.04% | 0.16% | 0.26% | 0.21% | |
| CAD | -0.19% | 0.08% | 0.15% | -0.04% | 0.12% | 0.20% | 0.20% | |
| AUD | -0.28% | -0.07% | 0.01% | -0.16% | -0.12% | 0.08% | 0.02% | |
| NZD | -0.41% | -0.17% | -0.09% | -0.26% | -0.20% | -0.08% | -0.04% | |
| CHF | -0.32% | -0.11% | -0.04% | -0.21% | -0.20% | -0.02% | 0.04% |
The heat map shows percentage changes of major currencies against each other. The base currency is picked from the left column, while the quote currency is picked from the top row. For example, if you pick the Japanese Yen from the left column and move along the horizontal line to the US Dollar, the percentage change displayed in the box will represent JPY (base)/USD (quote).
Recommended Articles











Comments (0)
Click the $ button, enter the symbol, and select to link a stock, ETF, or other ticker.