


Australian Dollar trades little changed as hawkish Fed and RBA outlooks collide



- AUD/USD trades sideways as hawkish Fed and RBA signals offset each other.
- A heavy slate of economic data next week puts the focus on the Australian CPI and the US PCE Price Index.
- Technically, AUD/USD remains under pressure, with the RSI below the neutral 50 mark and price below the 20-day SMA.
AUD/USD trades little changed on Friday as hawkish policy signals from both the Federal Reserve (Fed) and the Reserve Bank of Australia (RBA) offset each other, keeping the pair range-bound despite a modest pullback in the US Dollar (USD). At the time of writing, the pair trades around 0.7011 and remains on track for a weekly loss.
Earlier this week, both the Fed and RBA kept interest rates unchanged but signaled openness to rate hikes later this year amid persistent inflation as policymakers remain committed to bringing inflation back to their respective targets.
Meanwhile, easing tensions in the Middle East is providing some support to risk-sensitive currencies such as the Aussie. Still, upside in AUD/USD could remain limited as traders await fresh economic data for clues on the future path of interest rates in both the United States and Australia.
Next week's economic calendar features Australian Consumer Price Index (CPI) and labor market data, along with the US Personal Consumption Expenditures (PCE) Price Index, and the final reading of the Q1 Gross Domestic Product (GDP).
Traders will also monitor preliminary global Purchasing Managers Index (PMI) surveys and the People's Bank of China's (PBoC) interest rate decision. The Australian Dollar is highly sensitive to Chinese economic data, given Australia's close trade ties with China.
Technical analysis:
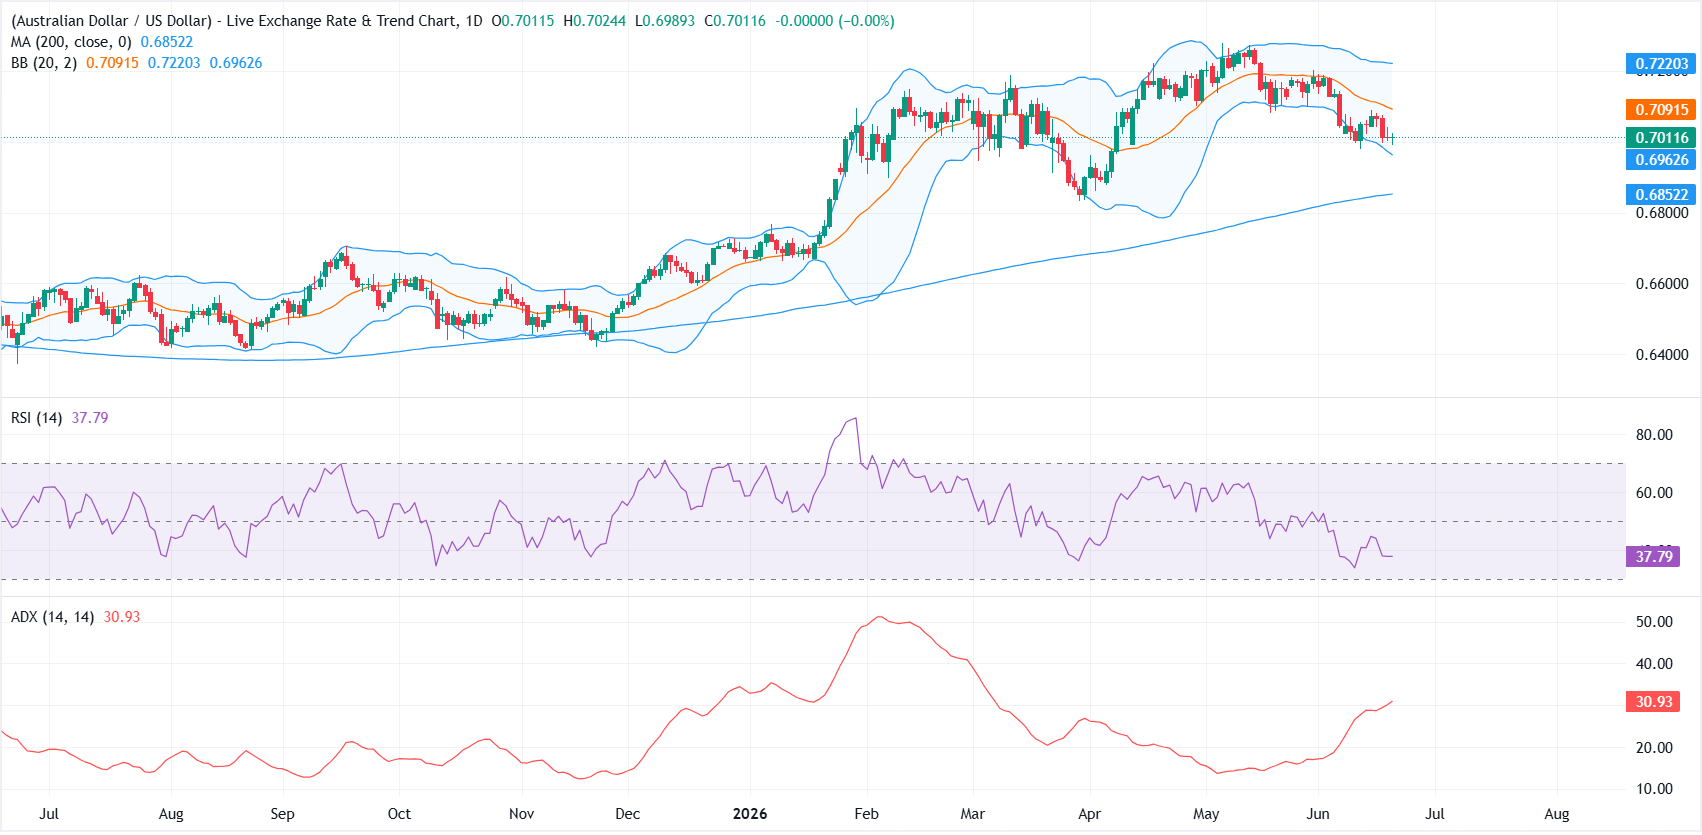
On the daily chart, AUD/USD maintains a bearish near-term bias, with spot remaining below the Bollinger middle band, which corresponds to the 20-day Simple Moving Average (SMA) near 0.7091. Although the pair remains comfortably above the 200-day SMA at 0.6852, the failure to reclaim the 20-day SMA suggests sellers retain control. The Relative Strength Index (RSI) at 37 remains below the neutral 50 mark, pointing to persistent bearish momentum, while the Average Directional Index (ADX) near 31 indicates the downtrend is gaining strength.
On the upside, initial resistance is seen at the 20-day SMA/Bollinger midline near 0.7091, with the upper Bollinger band around 0.7220 acting as the next hurdle. On the downside, immediate support is located near the lower Bollinger band around 0.6963, followed by the 200-day SMA at 0.6852. A decisive break below the latter would reinforce the broader bearish outlook.
US Dollar Price Today
The table below shows the percentage change of US Dollar (USD) against listed major currencies today. US Dollar was the strongest against the Swiss Franc.
| USD | EUR | GBP | JPY | CAD | AUD | NZD | CHF | |
|---|---|---|---|---|---|---|---|---|
| USD | -0.17% | -0.22% | -0.08% | 0.25% | 0.00% | 0.23% | 0.28% | |
| EUR | 0.17% | -0.05% | 0.11% | 0.42% | 0.17% | 0.39% | 0.45% | |
| GBP | 0.22% | 0.05% | 0.15% | 0.46% | 0.23% | 0.45% | 0.51% | |
| JPY | 0.08% | -0.11% | -0.15% | 0.31% | 0.10% | 0.30% | 0.35% | |
| CAD | -0.25% | -0.42% | -0.46% | -0.31% | -0.20% | -0.02% | 0.03% | |
| AUD | -0.00% | -0.17% | -0.23% | -0.10% | 0.20% | 0.21% | 0.28% | |
| NZD | -0.23% | -0.39% | -0.45% | -0.30% | 0.02% | -0.21% | 0.04% | |
| CHF | -0.28% | -0.45% | -0.51% | -0.35% | -0.03% | -0.28% | -0.04% |
The heat map shows percentage changes of major currencies against each other. The base currency is picked from the left column, while the quote currency is picked from the top row. For example, if you pick the US Dollar from the left column and move along the horizontal line to the Japanese Yen, the percentage change displayed in the box will represent USD (base)/JPY (quote).
Recommended Articles











Comments (0)
Click the $ button, enter the symbol, and select to link a stock, ETF, or other ticker.