

AUD/USD Price Forecasts: Aussie nears 0.7050 resistance area

- AUD/USD extends recovery from 0.6900, approaching the channel top at 0.7050.
- Risk appetite and hopes of further Fed cuts are buoying the Aussie.
- The RBA's hawkish stance has created an AUD-supportive monetary policy divergence.
,
The Aussie Dollar appreciates for the second consecutive day against a softer US Dollar, approaching the top of February’s trading channel at the 0.7050 area. Positive risk sentiment and rising bets that the US Federal Reserve will cut interest rates sooner rather than later are keeping the pair buoyed.
In contrast, the Reserve Bank of Australia raised interest rates last week, and Governor Michelle Bullock hinted at further monetary tightening to dampen demand growth. This stance has created a monetary policy divergence that is underpinning the Australian Dollar’s recovery
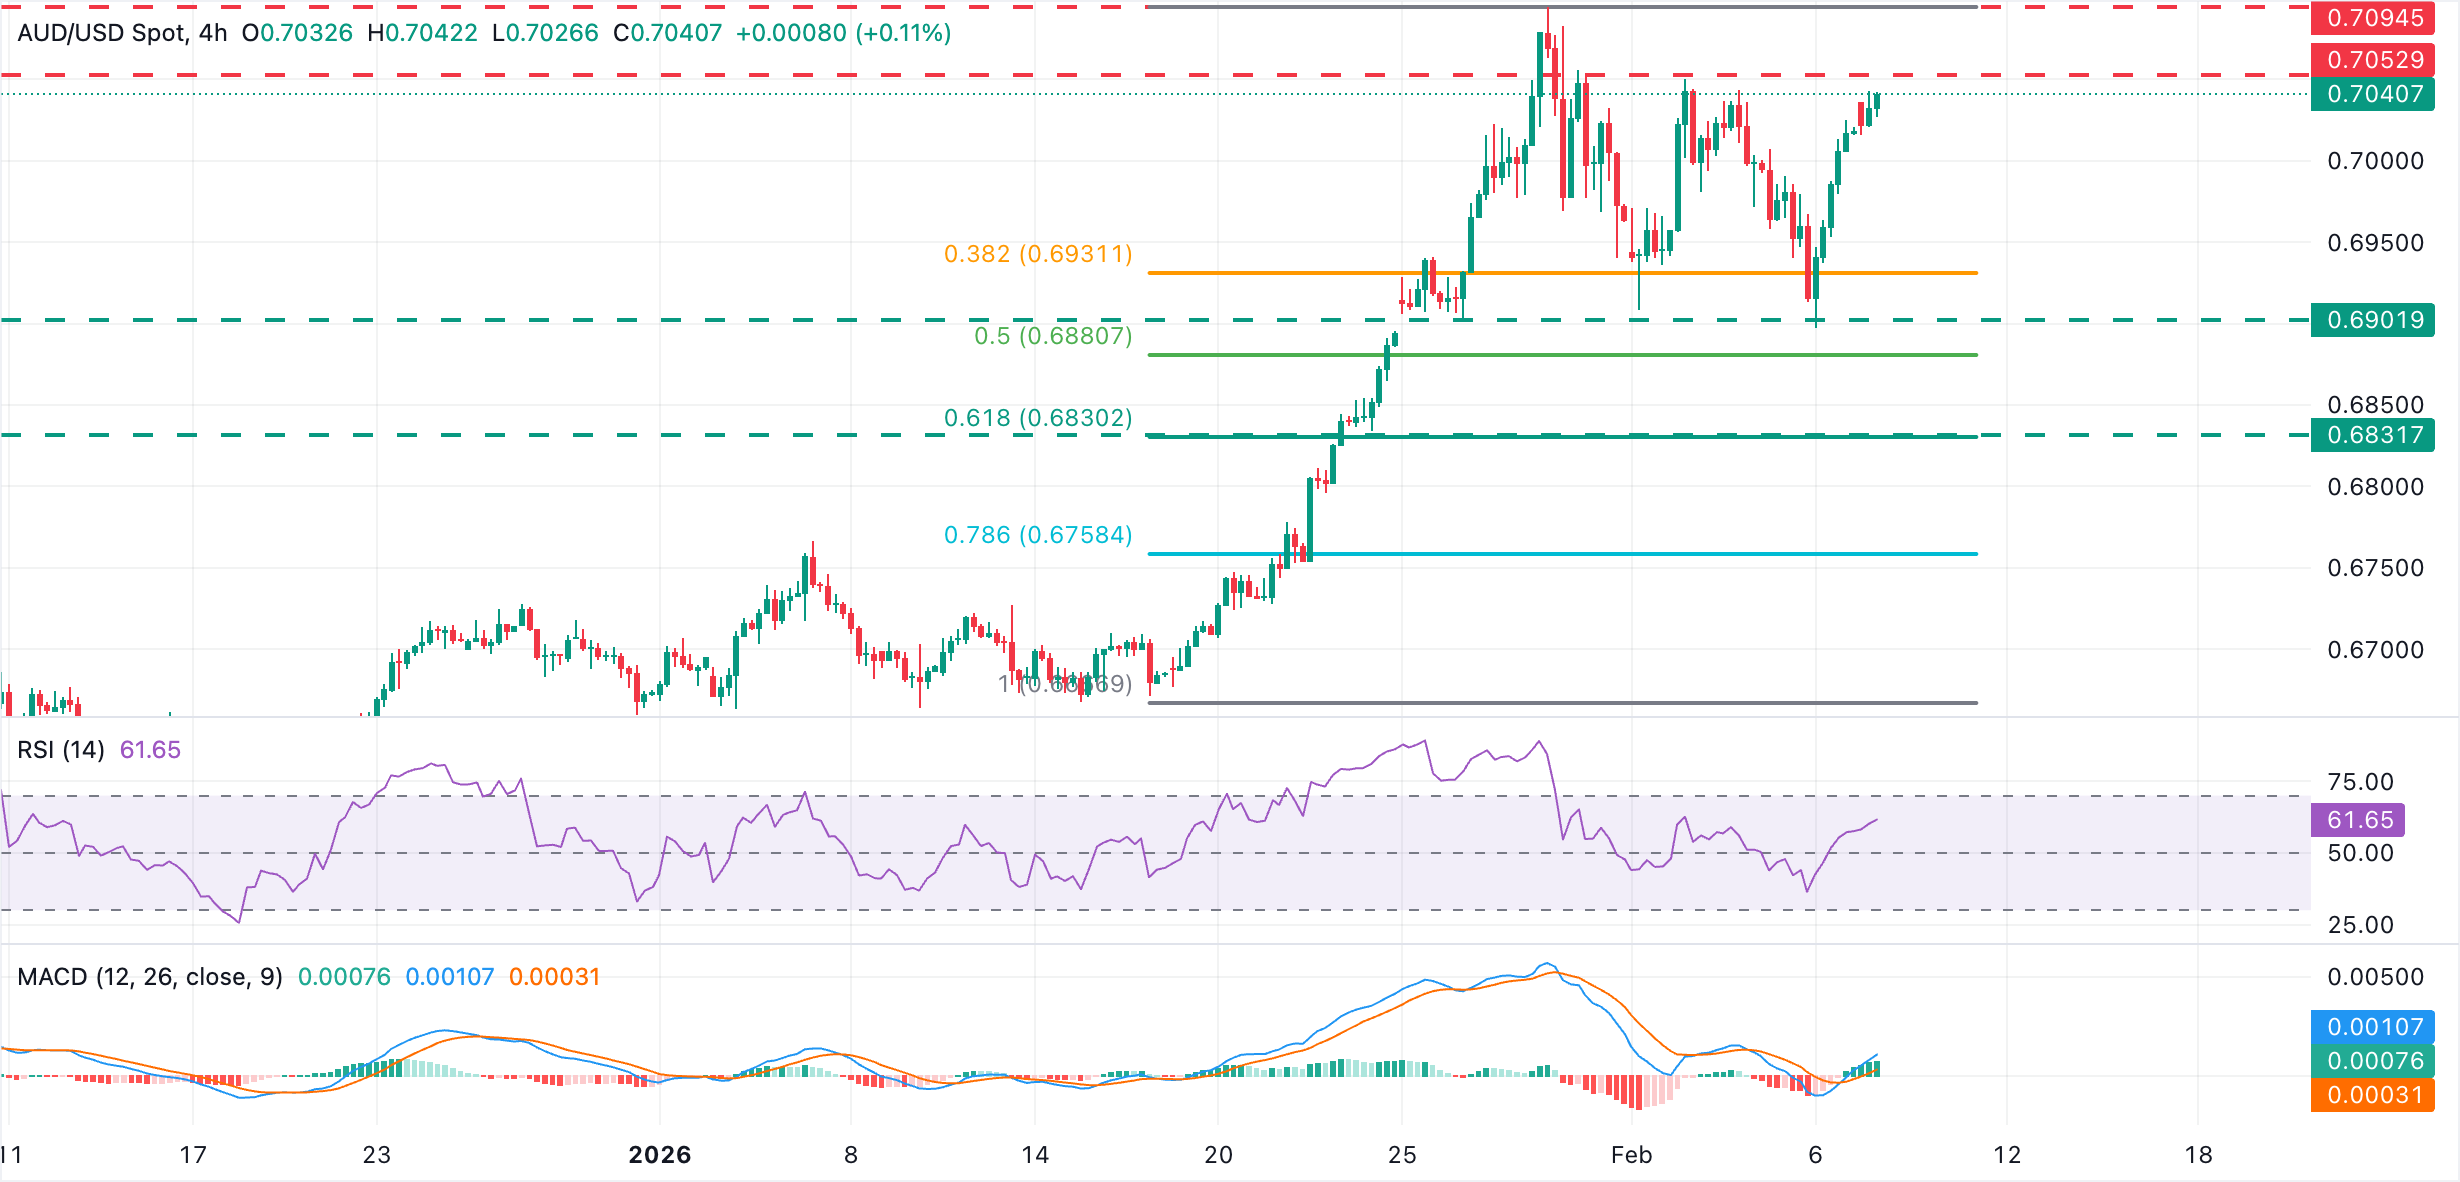
Technical Analysis
The AUD/USD has been consolidating above 0.6900 and is about to resume its broader uptrend, favoured by the US Dollar's weakness. The 4-hour Moving Average Convergence Divergence (MACD) line stands above the signal line and in positive territory, and the Relative Strength Index (RSI) prints above the 60 level, reinforcing an upward bias.
Bulls, however, will have to break above the January 30 and February 3 highs, right above 0.7050 and the January 29 high, at 0.7095, to confirm a further escalation.
On the downside, the 0.7000 round level might provide some support. The key support area is the 0.6900 level, which held bears several times in late January and early February. A break of that level might lure sellers into the 0.6830 area, where 61.8% Fibonacci retracement level of the late January rally meets the January 23 low.
(The technical analysis of this story was written with the help of an AI tool.)
US Dollar Price Today
The table below shows the percentage change of US Dollar (USD) against listed major currencies today. US Dollar was the strongest against the British Pound.
| USD | EUR | GBP | JPY | CAD | AUD | NZD | CHF | |
|---|---|---|---|---|---|---|---|---|
| USD | -0.39% | 0.09% | -0.41% | -0.14% | -0.37% | -0.01% | -0.44% | |
| EUR | 0.39% | 0.47% | -0.04% | 0.23% | 0.02% | 0.39% | -0.05% | |
| GBP | -0.09% | -0.47% | -0.51% | -0.26% | -0.43% | -0.10% | -0.53% | |
| JPY | 0.41% | 0.04% | 0.51% | 0.25% | 0.04% | 0.40% | -0.05% | |
| CAD | 0.14% | -0.23% | 0.26% | -0.25% | -0.22% | 0.15% | -0.29% | |
| AUD | 0.37% | -0.02% | 0.43% | -0.04% | 0.22% | 0.36% | -0.07% | |
| NZD | 0.00% | -0.39% | 0.10% | -0.40% | -0.15% | -0.36% | -0.44% | |
| CHF | 0.44% | 0.05% | 0.53% | 0.05% | 0.29% | 0.07% | 0.44% |
The heat map shows percentage changes of major currencies against each other. The base currency is picked from the left column, while the quote currency is picked from the top row. For example, if you pick the US Dollar from the left column and move along the horizontal line to the Japanese Yen, the percentage change displayed in the box will represent USD (base)/JPY (quote).
Recommended Articles


Comments (0)
Click the $ button, enter the symbol, and select to link a stock, ETF, or other ticker.