


GBP/JPY Price Forecast: Resistance at 211.50 keeps holding the Pound



- GBP/JPY retreats from the 211.50 resistance area amid broad-based Pound weakness.
- BoJ Governor Ueda's comments have provided some support to the Yen.
- A break below 210.00 would confirm a triple top at 211.50.
The Sterling has failed, once again, to break above the resistance area at 211.50, where it was capped on December 22 and 26, and is trading lower on Monday. Technical indicators hint at a weaker bullish momentum, although the pair has not shown a clear sign of a trend shift as of yet.
In the fundamental front, the Bank of Japan’s (BoJ) Governor, Kazuho Ueda, has reiterated the central bank’s commitment to keep tightening its monetary policy if its economic projections are met. This, coupled with a broader GBP weakness, is keeping the pair on the back foot on Monday.
Technical analysis: Key support is at 210.00
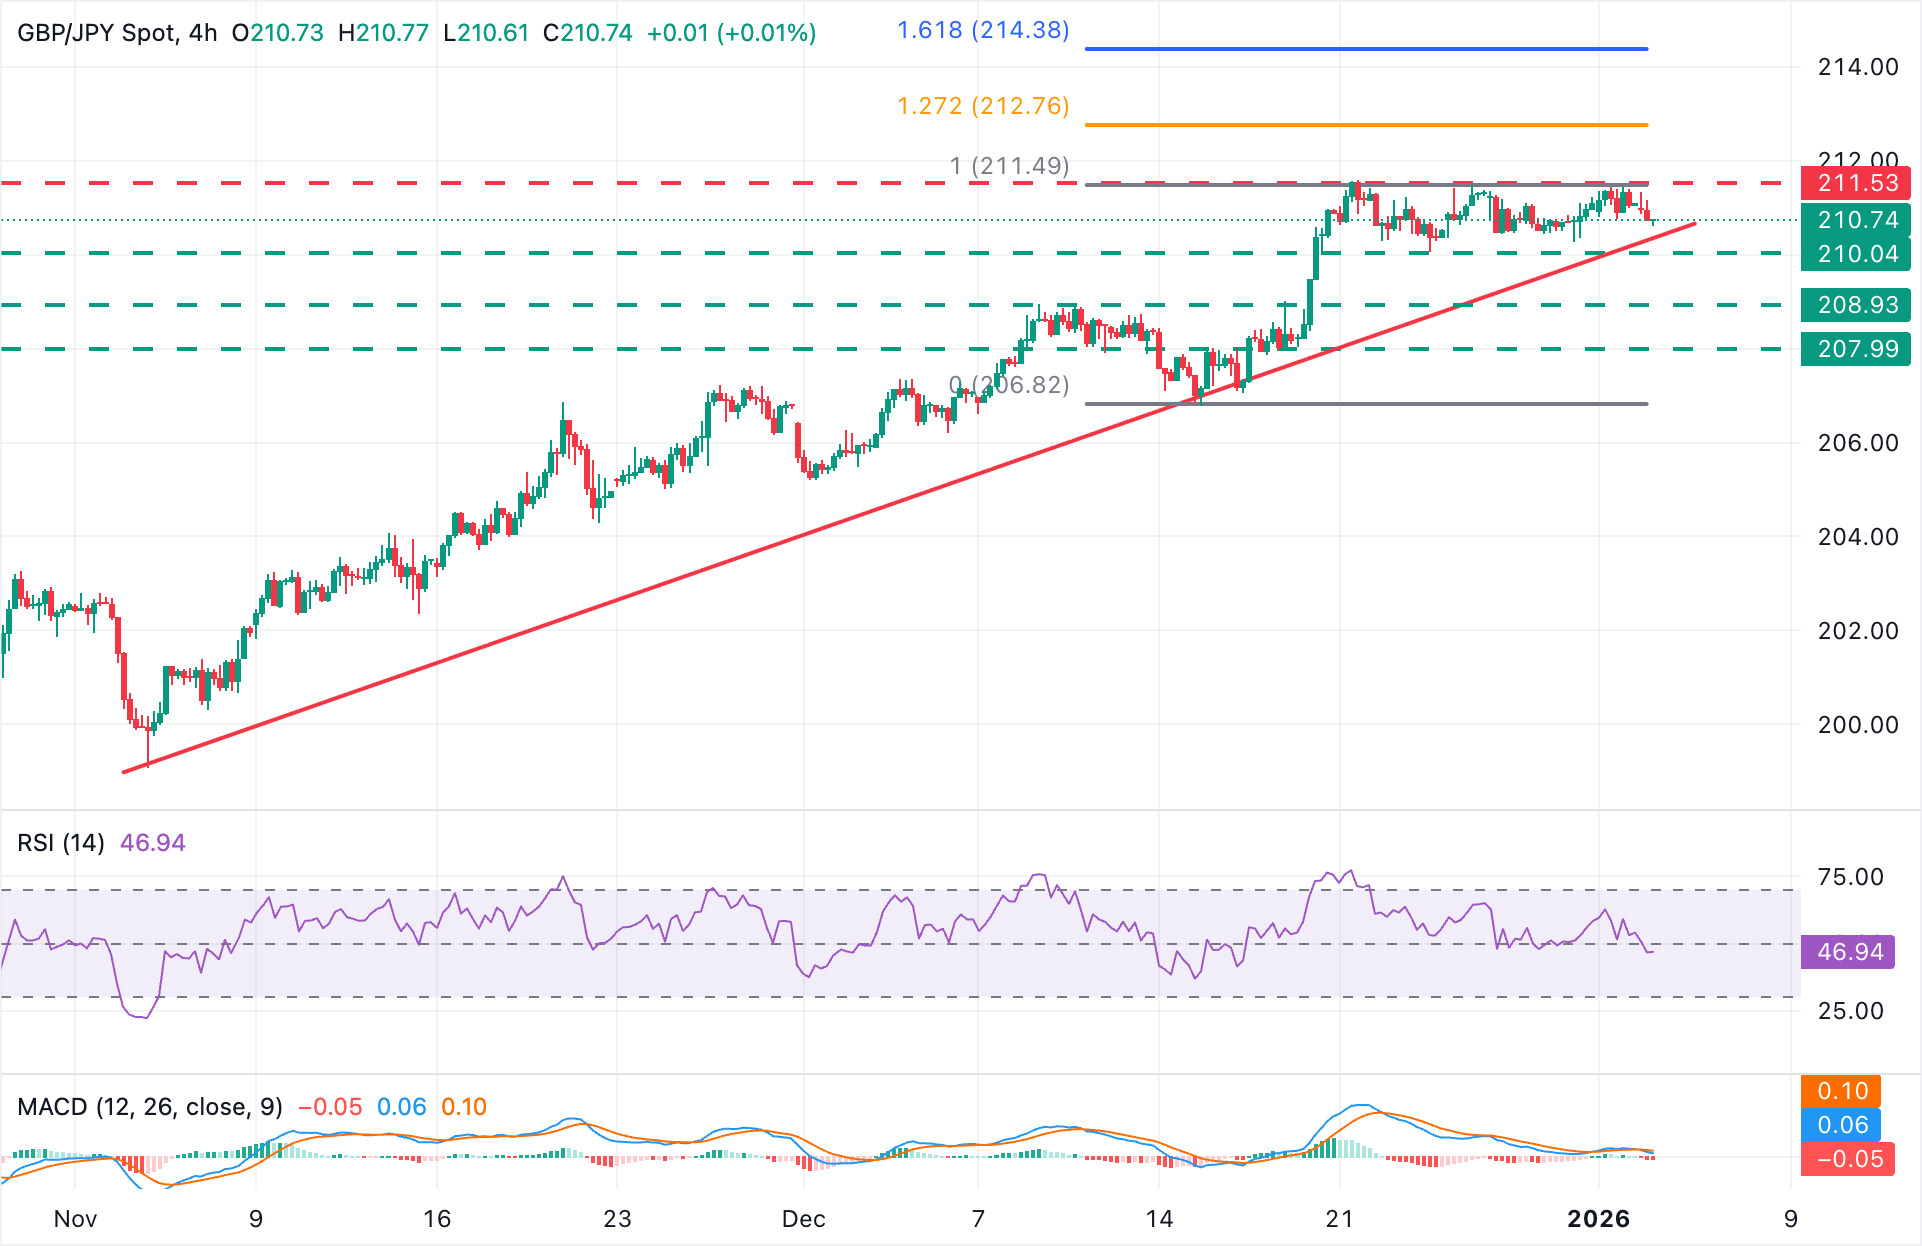
In the 4-hour chart, GBP/JPY trades at 210.88, posting moderate losses on the daily chart after rejection at the 211.50 area on Friday.
Technical indicators show are heading lower. The Relative Strength Index (RSI) is testing levels below the key 50 line, showing some bearish divergence with price action. The Moving Average Convergence Divergence (MACD) turns marginally negative near the zero line, and the MACD line slips below the Signal line, highlighting a fading momentum.
Trendline support is now at the 210.50 area, but a decline below 210.05 (December 24 low) would be needed to confirm a triple top in the 211.50 area and signal a trend shift. The next downside targets would be the November 9 and 1o highs, at 208.90, and the December 19 low, near 208.00.
On the upside, above the long-term high, at 211.59 (December 22 high), the potential targets are the 127.2% Fibonacci extension of the December 15 to December 22 rally, at 212.75, and the 161.8% extension of the same cycle, at 214.38,.
(The technical analysis of this story was written with the help of an AI tool)
Pound Sterling Price Today
The table below shows the percentage change of British Pound (GBP) against listed major currencies today. British Pound was the strongest against the Canadian Dollar.
| USD | EUR | GBP | JPY | CAD | AUD | NZD | CHF | |
|---|---|---|---|---|---|---|---|---|
| USD | 0.25% | 0.21% | 0.05% | 0.28% | 0.24% | 0.25% | 0.24% | |
| EUR | -0.25% | -0.04% | -0.20% | 0.02% | -0.02% | -0.00% | -0.01% | |
| GBP | -0.21% | 0.04% | -0.17% | 0.07% | 0.03% | 0.04% | 0.03% | |
| JPY | -0.05% | 0.20% | 0.17% | 0.24% | 0.20% | 0.21% | 0.20% | |
| CAD | -0.28% | -0.02% | -0.07% | -0.24% | -0.04% | -0.03% | -0.04% | |
| AUD | -0.24% | 0.02% | -0.03% | -0.20% | 0.04% | 0.01% | 0.00% | |
| NZD | -0.25% | 0.00% | -0.04% | -0.21% | 0.03% | -0.01% | -0.01% | |
| CHF | -0.24% | 0.01% | -0.03% | -0.20% | 0.04% | -0.00% | 0.00% |
The heat map shows percentage changes of major currencies against each other. The base currency is picked from the left column, while the quote currency is picked from the top row. For example, if you pick the British Pound from the left column and move along the horizontal line to the US Dollar, the percentage change displayed in the box will represent GBP (base)/USD (quote).
Recommended Articles







Comments (0)
Click the $ button, enter the symbol, and select to link a stock, ETF, or other ticker.