


GBP/USD Price Forecast: Holds above nine-day EMA near 1.3450



- GBP/USD may test the three-month high of 1.3534.
- The 14-day Relative Strength Index 62.76 signals bullish momentum.
- The immediate support lies at the nine-day EMA at 1.3468.
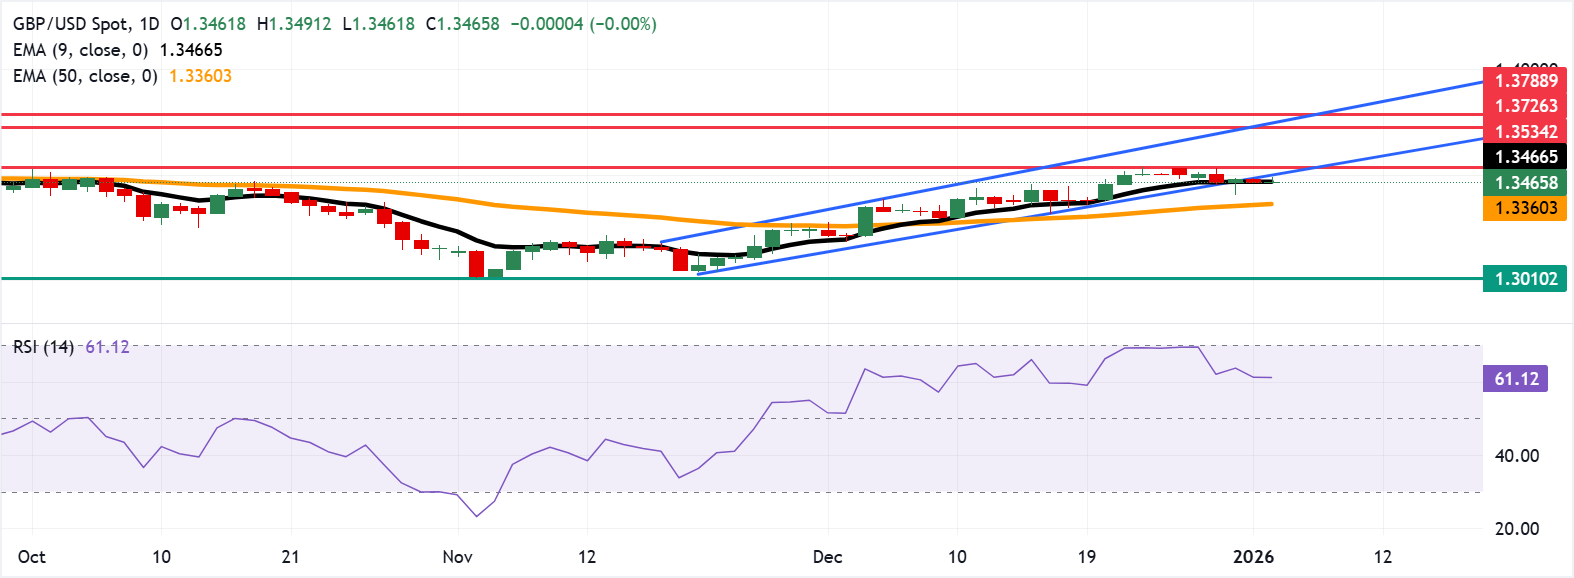
GBP/USD edges higher on the first day of the year, trading around 1.3470 during the Asian hours on Friday. The technical analysis of the daily chart indicates a weakening of a bullish bias as the pair remains slightly below the lower boundary of the ascending channel pattern.
The nine-day Exponential Moving Average (EMA) rises and stands above the 50-day EMA, with spot holding over both and maintaining a bullish bias. The 50-day EMA slope is positive, supporting the uptrend. Short-term trend dynamics remain supportive as the nine-day EMA continues to lead the 50-day EMA, and price respects the former on pullbacks. The moving average configuration would keep the topside favored while the medium-term average edges higher.
The 14-day Relative Strength Index (RSI) at 62.76 (bullish) confirms firm momentum without overbought conditions. RSI around 62.76 stays above its midline, reinforcing bullish bias and leaving scope for further gains.
A return to the ascending channel would support the GBP/USD pair to test the three-month high of 1.3534, reached on December 24. A daily close above this level could open a move toward the six-month high of 1.3726, followed by the upper boundary of the ascending channel around 1.3750.
A failure to rebound within the channel could prompt consolidation, but only a break below the nine- and 50-day EMAs of 1.3468 and 1.3362 supports, respectively, would undermine the short- and medium-term advance. Further declines would put downward pressure on the GBP/USD pair to navigate the region around the eight-month low of 1.3010.
Pound Sterling Price Today
The table below shows the percentage change of British Pound (GBP) against listed major currencies today. British Pound was the strongest against the Japanese Yen.
| USD | EUR | GBP | JPY | CAD | AUD | NZD | CHF | |
|---|---|---|---|---|---|---|---|---|
| USD | -0.13% | 0.01% | 0.06% | -0.05% | -0.29% | -0.07% | -0.11% | |
| EUR | 0.13% | 0.00% | 0.18% | 0.08% | -0.22% | 0.06% | 0.02% | |
| GBP | -0.01% | 0.00% | 0.19% | 0.04% | -0.22% | 0.06% | 0.03% | |
| JPY | -0.06% | -0.18% | -0.19% | -0.12% | -0.48% | -0.19% | -0.16% | |
| CAD | 0.05% | -0.08% | -0.04% | 0.12% | -0.28% | -0.04% | -0.05% | |
| AUD | 0.29% | 0.22% | 0.22% | 0.48% | 0.28% | 0.28% | 0.25% | |
| NZD | 0.07% | -0.06% | -0.06% | 0.19% | 0.04% | -0.28% | -0.03% | |
| CHF | 0.11% | -0.02% | -0.03% | 0.16% | 0.05% | -0.25% | 0.03% |
The heat map shows percentage changes of major currencies against each other. The base currency is picked from the left column, while the quote currency is picked from the top row. For example, if you pick the British Pound from the left column and move along the horizontal line to the US Dollar, the percentage change displayed in the box will represent GBP (base)/USD (quote).
(The technical analysis of this story was written with the help of an AI tool.)
Recommended Articles









Comments (0)
Click the $ button, enter the symbol, and select to link a stock, ETF, or other ticker.