


NZD/USD Price Forecasts: Kiwi’s recovery beyond 0.5800 looks frail



- NZD/USD has returned above 0.5800, yet with bullish momentum looking frail
- Escalating tensions between China and Taiwan are likely to weigh on the risk-sensitive Kiwi.
- Technically, the pair's rally from mid-November lows seems to have lost momentum.
The New Zealand Dollar has trimmed some losses on Tuesday, returning to levels above 0.5800 at the time of writing, but recovery attempts look frail so far. Technical indicators remain neutral-to-bearish, and the growing geopolitical tensions in Asia are not particularly supportive.
China holds military drills around the island of Taiwan, including real rocket-firing exercises in retaliation for an agreement with the US to send a $11 billion weapons package to Taipei. Taiwan announced the deployment of its missile systems.
The escalation of tensions in an already sensitive area has weighed on Asian stock markets, which are going through moderate losses at the time of writing, and is likely to keep the risk-sensitive Kiwi under pressure.
Technical Analysis. Support 0.5790 remains in play
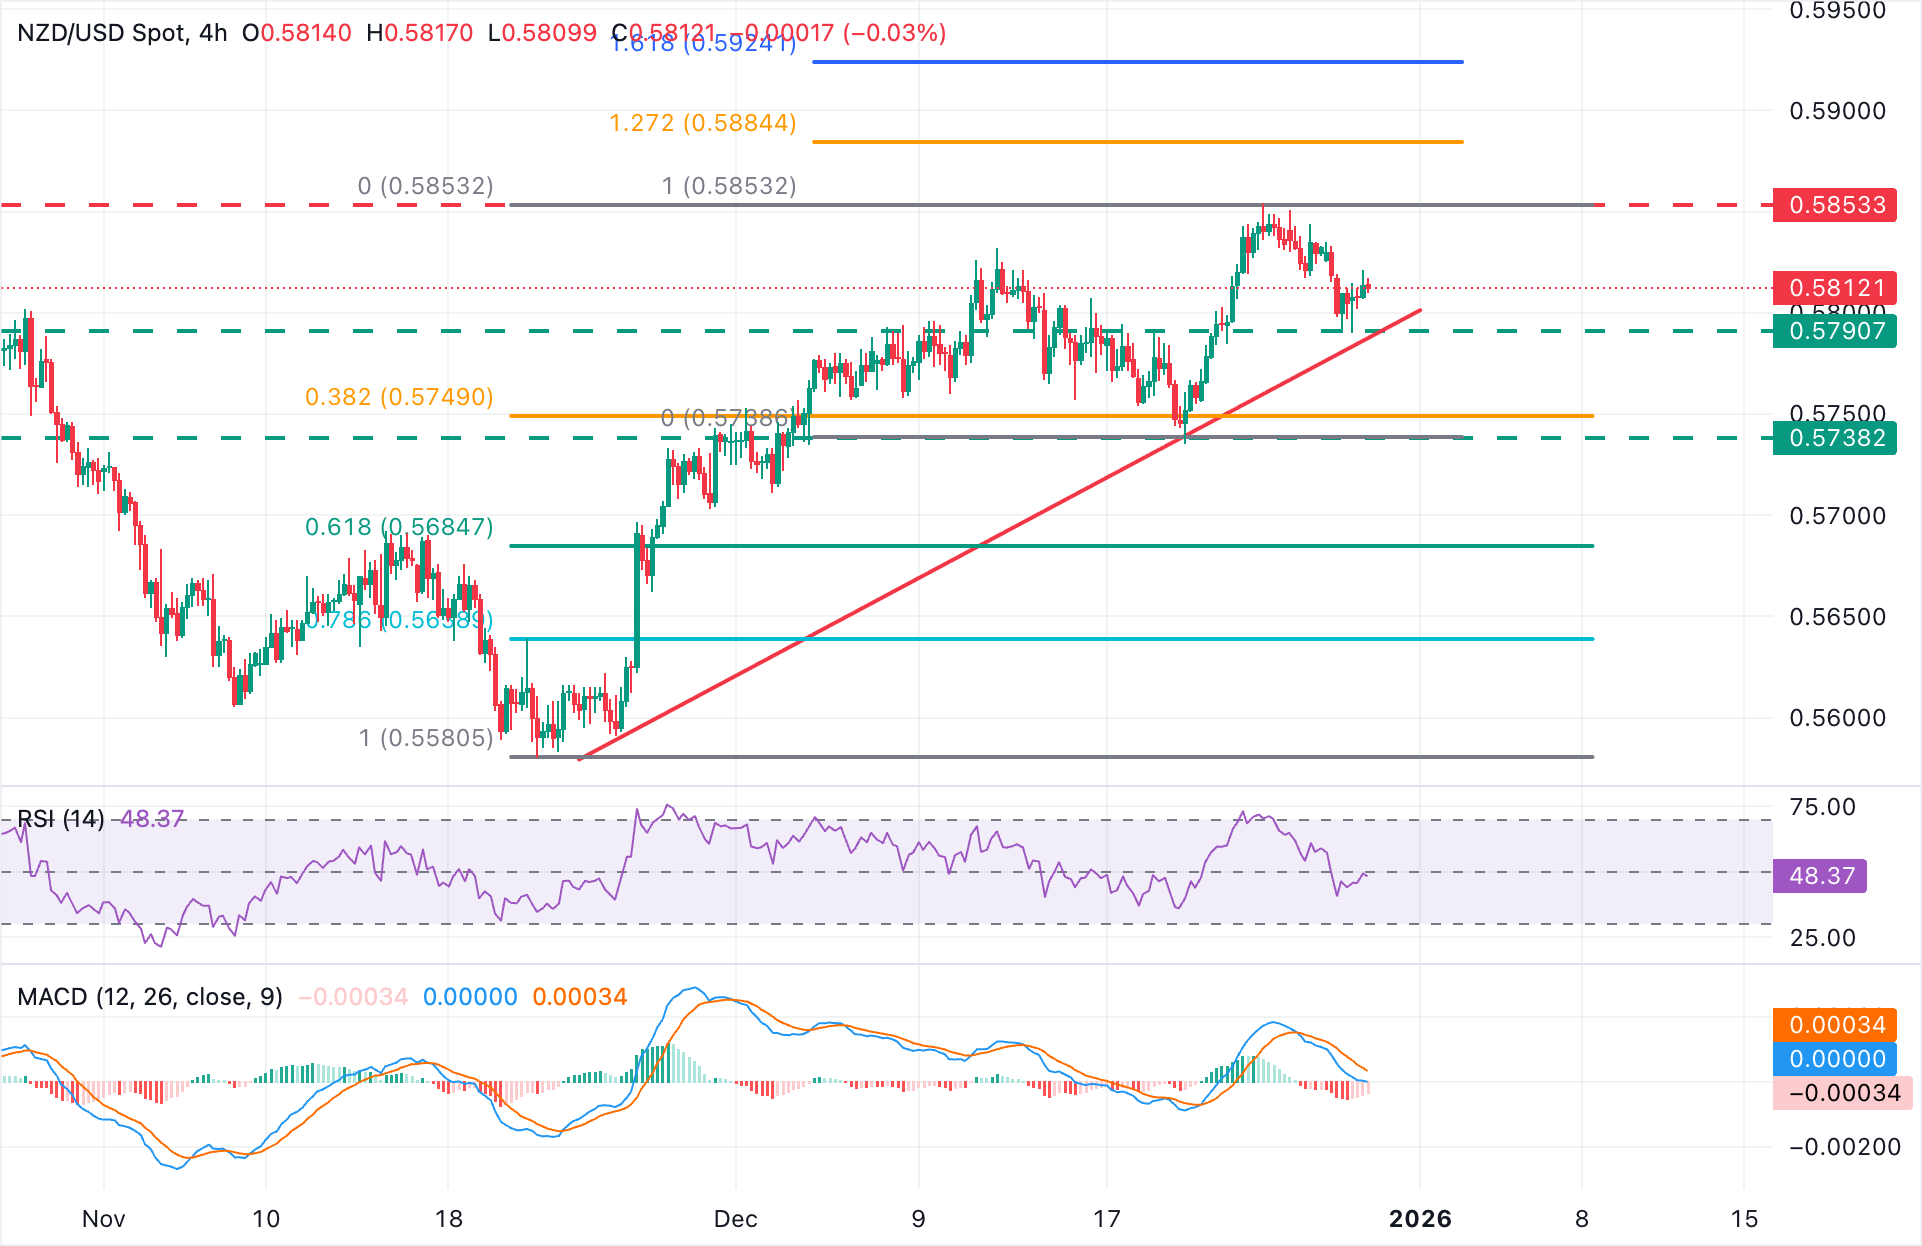
In the 4-hour chart, NZD/USD trades at 0.5814, little changed daily. Price action remains above trendline support from mid-November lows, highlighting the broader bullish trend, but technical indicators hint at a fading momentum.
The Relative Strength Index (RSI) has bounced up from 40 but remains below the key 50 level, and the
Moving Average Convergence Divergence (MACD) remains below zero.
Immediate support is at the 0.5790 area, where the trendline support meets Monday's low. Further down, the December 19 low, at 0.5735, would come to the focus, ahead of the 61.8% Fibonacci retracement of the November-December rally and mid-November highs, at the 0.5690 area.
To the upside, resistance around 0.5855 has capped gains on October 6 and December 24. Further up, the 1.27.2% and 161.8% Fibonacci extensions of the December 19-24 rally are at 0.5885 and 0.5925, respectively
(The technical analysis of this story was written with the help of an AI tool)
US Dollar Price Today
The table below shows the percentage change of US Dollar (USD) against listed major currencies today. US Dollar was the strongest against the Euro.
| USD | EUR | GBP | JPY | CAD | AUD | NZD | CHF | |
|---|---|---|---|---|---|---|---|---|
| USD | -0.03% | -0.08% | -0.11% | -0.04% | -0.18% | -0.12% | -0.04% | |
| EUR | 0.03% | -0.05% | -0.11% | -0.02% | -0.16% | -0.10% | -0.02% | |
| GBP | 0.08% | 0.05% | -0.04% | 0.03% | -0.12% | -0.05% | 0.01% | |
| JPY | 0.11% | 0.11% | 0.04% | 0.07% | -0.07% | -0.02% | 0.11% | |
| CAD | 0.04% | 0.02% | -0.03% | -0.07% | -0.13% | -0.05% | -0.01% | |
| AUD | 0.18% | 0.16% | 0.12% | 0.07% | 0.13% | 0.07% | 0.13% | |
| NZD | 0.12% | 0.10% | 0.05% | 0.02% | 0.05% | -0.07% | 0.07% | |
| CHF | 0.04% | 0.02% | -0.01% | -0.11% | 0.01% | -0.13% | -0.07% |
The heat map shows percentage changes of major currencies against each other. The base currency is picked from the left column, while the quote currency is picked from the top row. For example, if you pick the US Dollar from the left column and move along the horizontal line to the Japanese Yen, the percentage change displayed in the box will represent USD (base)/JPY (quote).
,
Recommended Articles









Comments (0)
Click the $ button, enter the symbol, and select to link a stock, ETF, or other ticker.