


 Discount


Chainlink Price Forecast: LINK holds key support as ETF outflows, bearish bias persist



- Chainlink hovers above $9 on Wednesday, maintaining a crucial support level after last week’s 10% decline.
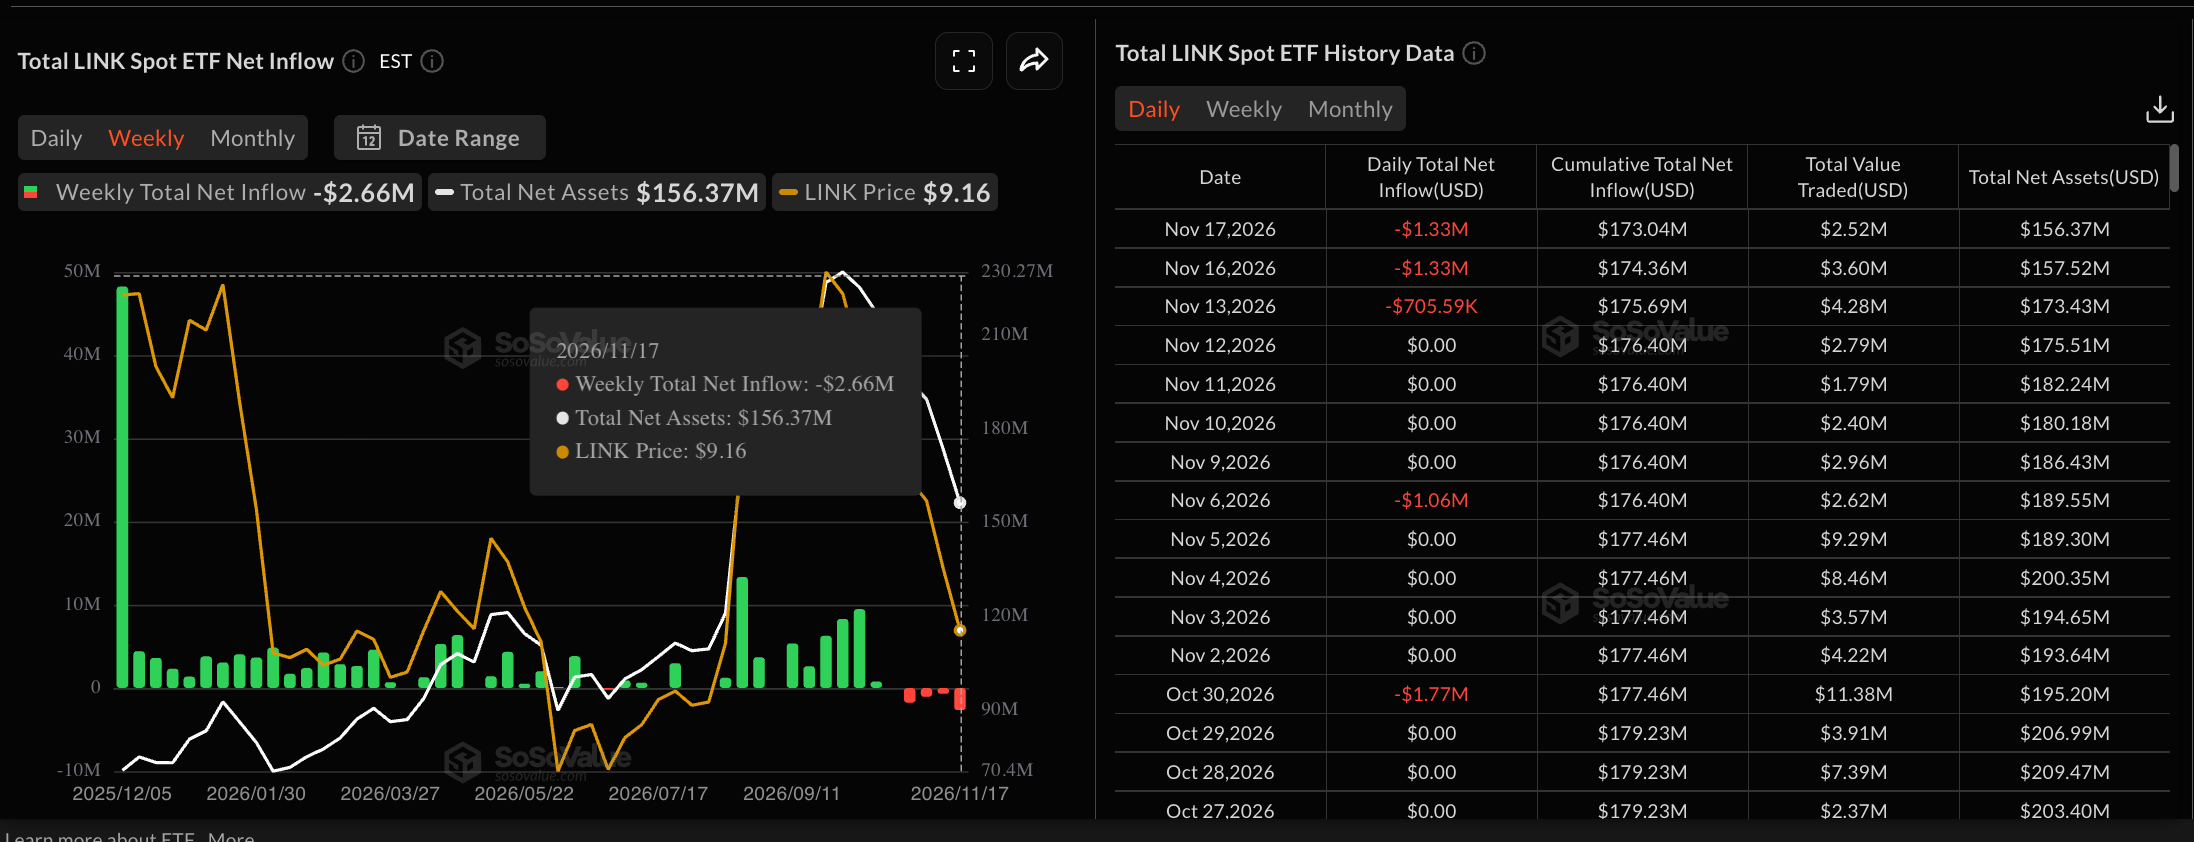
- LINK-focused ETFs recorded their third consecutive day of outflows, with $1.33 million withdrawn on Tuesday.
- The technical outlook for LINK is mixed as persistent downside momentum approaches oversold conditions.
Chainlink (LINK) shows a relief attempt above $9.00 on Wednesday, defending a crucial support level near $8.60 after last week’s 10% losses. LINK-focused Exchange Traded Funds (ETFs) continue to face selling pressure from institutional investors, recording over $2 million in outflows so far this week amid mixed signals from the derivatives market. Chainlink could extend its decline toward the $7.00 round figure if selling pressure persists.
LINK ETF outflows extend for the fourth week
Institutional investors continue to reduce their exposure to LINK for the fourth straight week. SoSoValue data shows LINK ETFs mirrored Monday’s $1.33 million in outflows on Tuesday, extending the previous week’s outflow of $705,590.
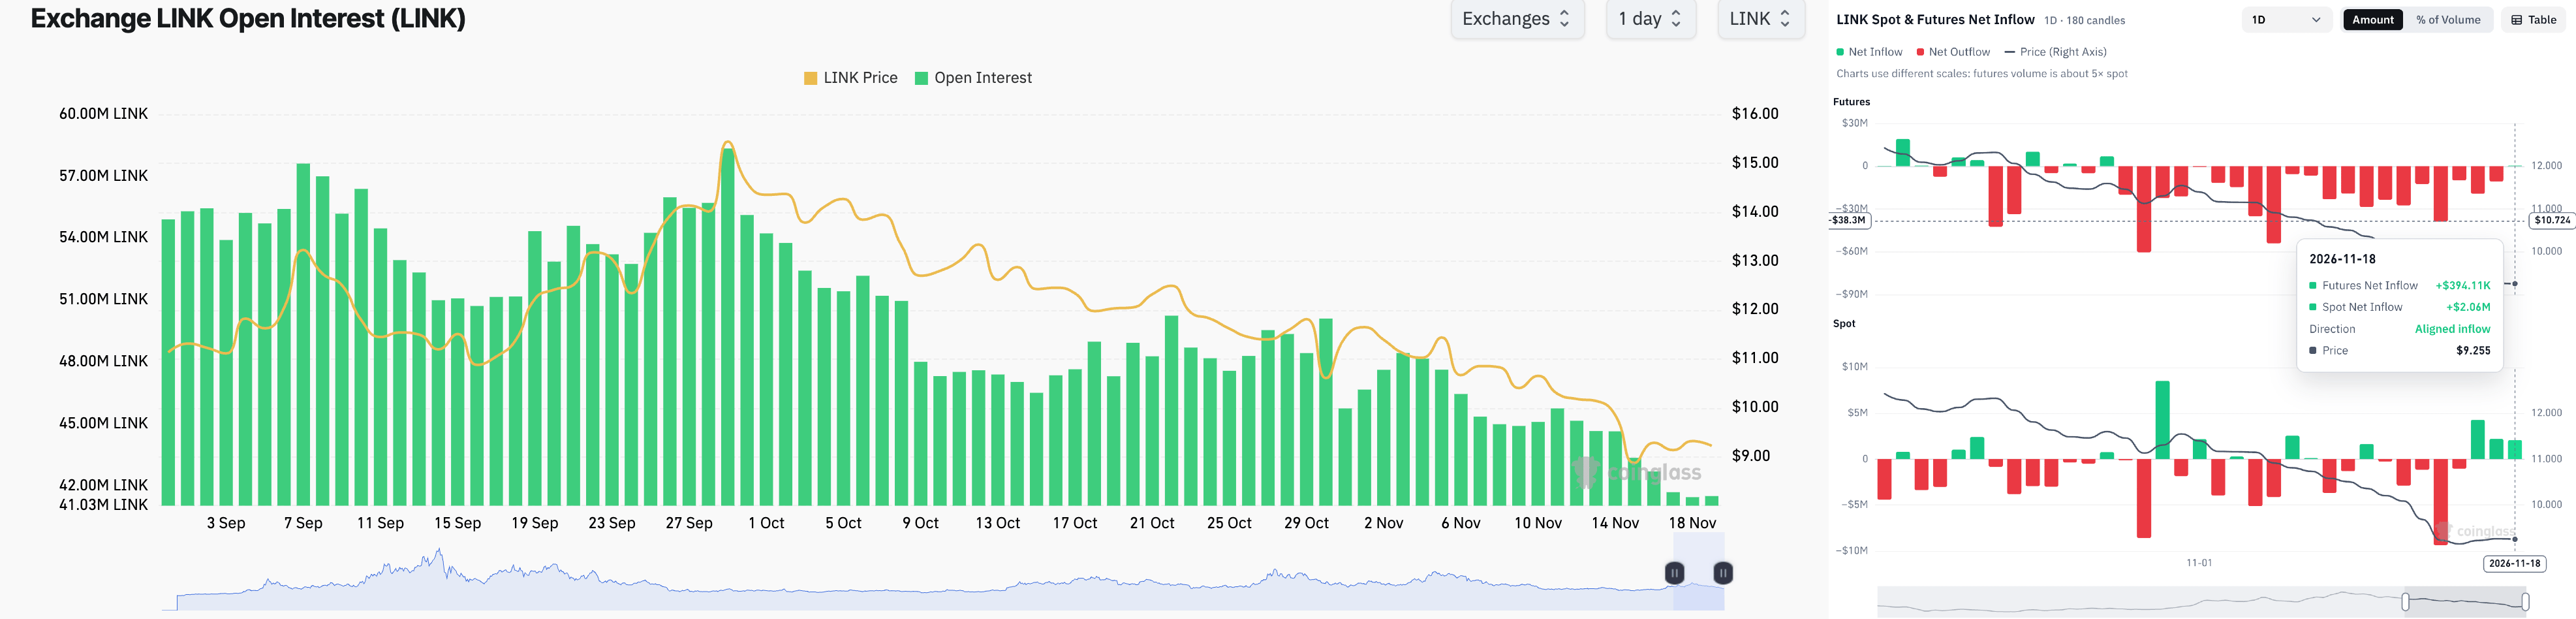
On the derivatives side, CoinGlass data shows the Chainlink futures Open Interest (OI) is down to 41.50 million LINK, from 45.75 million LINK last week, indicating a positional wipeout. Meanwhile, the futures and spot net inflows are at $394,110 and $2.06 million so far on Wednesday, hinting at potential capital inflows that could support its near-term recovery.
Technical outlook: Will LINK’s recovery reclaim $10?
Chainlink trades at $9.26 at press time on Wednesday, holding a bearish near-term bias well below the 200-day and 50-day Exponential Moving Averages (EMAs) at $10.89 and $11.09, respectively. This configuration suggests rallies are likely to be capped while the pair trades under this dense overhead band.
The Moving Average Convergence Divergence (MACD) line edges higher in negative territory, and the Relative Strength Index (RSI) stabilizes just above the oversold level of 34, hinting at slowing downside momentum rather than a confirmed reversal.
On the topside, initial resistance is seen at the horizontal barrier around $10.87, followed closely by the 200-day EMA at $10.89 and the 50-day EMA at $11.09, forming a critical confluence zone that bulls would need to reclaim to ease the broader bearish pressure, ahead of higher hurdles at $12.40 and $15.53.
Looking down, immediate support emerges at $8.60, with a deeper floor near $7.01, where buyers would be expected to show stronger interest if selling resumes.
(The technical analysis of this story was written with the help of an AI tool. Know more.)
Recommended Articles









Comments (0)
Click the $ button, enter the symbol, and select to link a stock, ETF, or other ticker.