


Chainlink Price Forecast: LINK holds at $10 as Moody’s Ratings completes CCIP testnet pilot



- Chainlink edges higher on Wednesday, taking a breather after the previous day’s 3% decline.
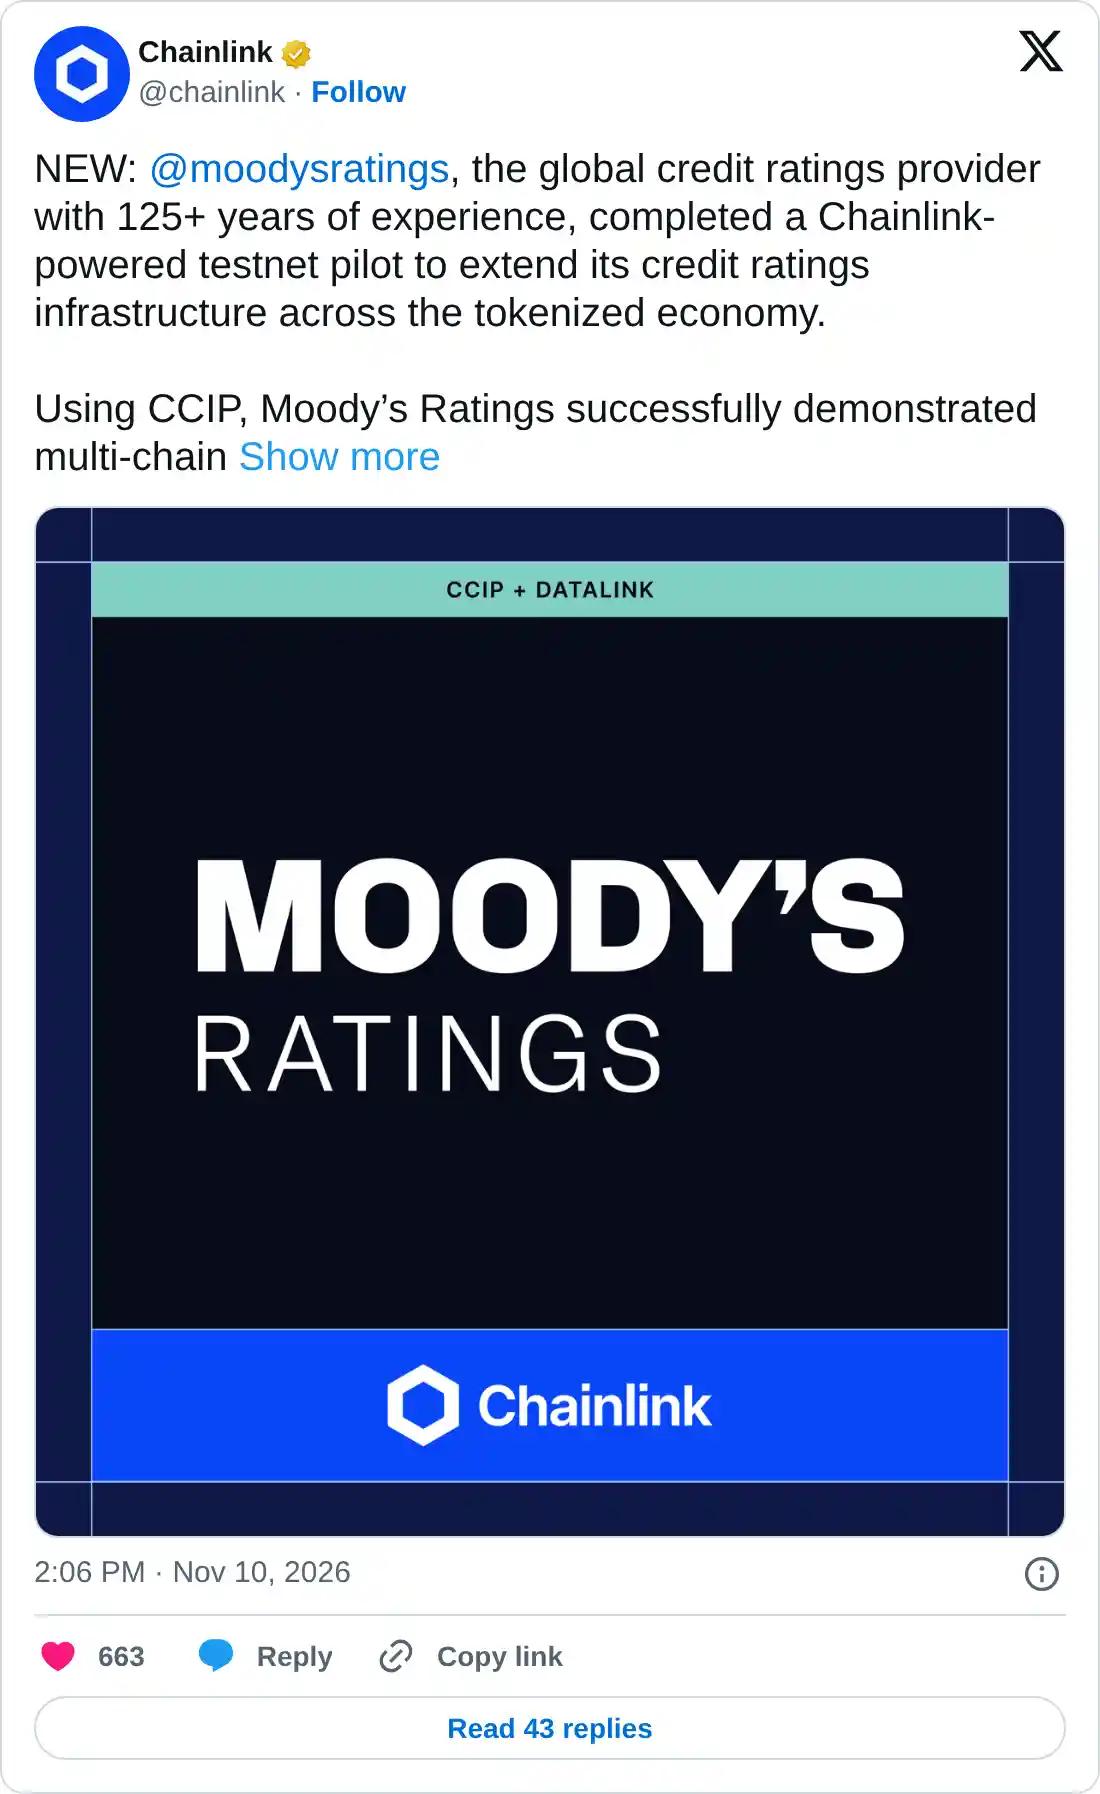
- Moody’s Rating completes the testnet pilot on Chainlink’s CCIP to distribute credit assessment data across multiple blockchain networks simultaneously.
- Charles Schwab extends access to the LINK token on Schwab Crypto from Monday.
Chainlink (LINK) hovers above $10 on Wednesday, struggling to find its footing amid a roughly 30% decline over the last five weeks. Moody’s Rating completed a testnet using Chainlink's protocols on Tuesday, while Charles Schwab started offering LINK to its clients, suggesting its expansion among financial institutions. The technical outlook for LINK is bearish, with dominant selling pressure.
Chainlink expands its institutional adoptions
Chainlink continues to onboard traditional financial giants to blockchain. Moody’s Rating completed the testnet pilot using Chainlink’s Cross-Chain Interoperability Protocol (CCIP) to distribute credit records for tokenized assets across multiple blockchain networks on Tuesday. This follows the announcement of Charles Schwab offering exposure to Chainlink’s LINK token to its Schwab Crypto clients.
Sellers dominate LINK derivatives
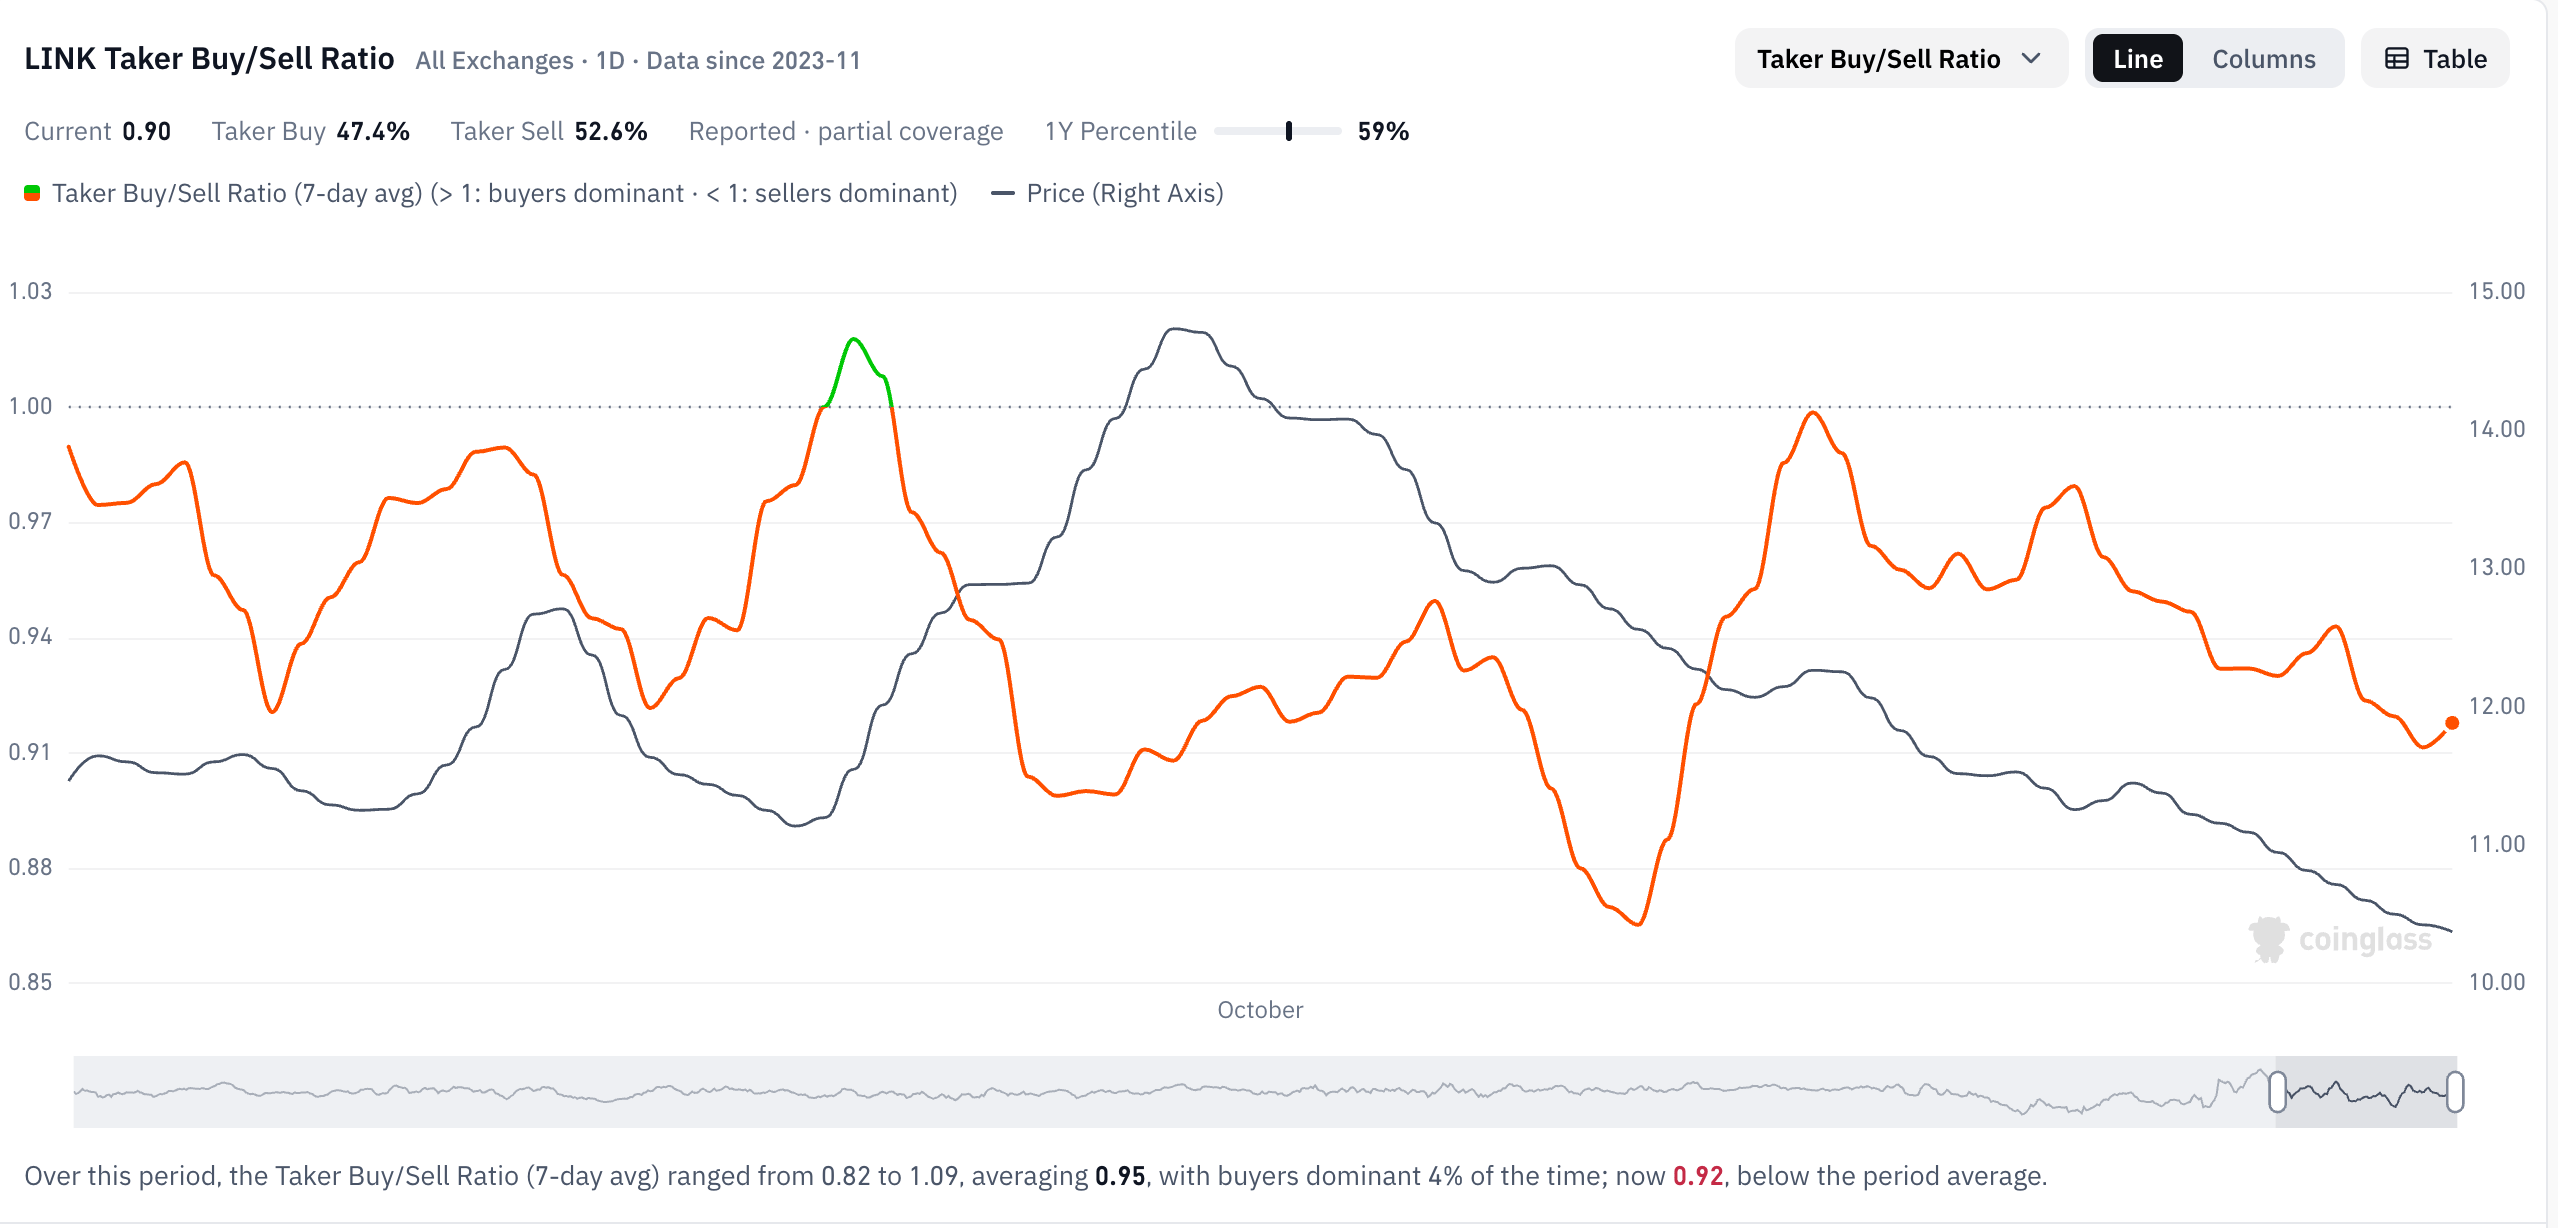
Chainlink faces renewed sell-side dominance in its derivatives market. CoinGlass data shows the LINK futures taker buy-to-sell ratio is down to 0.90, suggesting that market orders are sweeping through resting bids as traders are likely panic-selling.
Technical outlook: Can LINK avoid losses below $10?
Chainlink trades at $10.2750 at press time on Wednesday, extending a downward trend since early October. LINK maintains a bearish near-term bias as it trades below the 50-day and 200-day Exponential Moving Averages (EMAs) at $11.6465 and $10.9883, respectively.
The cluster of overhead barriers, starting from the horizontal cap at $10.8700 and extending through the 200-day EMA, suggests rallies are likely to meet supply.
Momentum remains weak on the daily chart, with the Relative Strength Index (RSI) around 36, staying in bearish territory, just above the oversold zone. At the same time, the Moving Average Convergence Divergence (MACD) remains below zero, indicating that downside momentum remains dominant.
Looking down, the immediate support emerges at $10.0340, with a break there likely opening the path toward $8.9700. A deeper pullback could find deeper cushions at $7.8500 and $7.0100, where buyers could attempt to build a more durable base.
On the topside, initial resistance is at $10.8700, followed by the 200-day EMA at $10.9883 and the 50-day EMA at $11.6465. A daily close above these EMAs would be needed to ease the prevailing downside pressure and expose higher resistance levels at $12.6080.
(The technical analysis of this story was written with the help of an AI tool. Know more.)
Recommended Articles










Comments (0)
Click the $ button, enter the symbol, and select to link a stock, ETF, or other ticker.