


Pi Network Price Forecast: PI extends gains against a bearish market backdrop



- Pi Network edges higher on Wednesday, extending its over 8% rebound from the previous day.
- PI token recovery shows near-term relief, decoupling from the broader cryptocurrency market correction.
- The technical outlook for PI is mixed, with the recovery still capped below a key resistance trendline.
Pi Network (PI) continues to attract some buyers on Wednesday after an over 8% rebound the previous day. PI token sustains above $0.070 as the price extends its rebound after reaching an oversold level, decoupling from the broader market correction. Technically, Pi Network must break above the overhead trendline near $0.0740 to resume an upward trend.
Pi Network shows early signs of renewed strength
Pi Network shows signs of recovery ahead of its three-day ecosystem summit starting on November 17. The first two days will be broadcast on YouTube, focusing on the developer platform, ecosystem initiatives, and AI, followed by the $200,000 prize-pool hackathon on the third day. This recovery shows signs of renewed social interest and potential retail demand ahead of the next Pi event.
Technical outlook: Can PI prompt a bullish trend reversal?
Pi Network trades at $0.0723, reinforcing a bearish bias as it remains well below the 50-day and 200-day Exponential Moving Averages (EMAs) at roughly $0.0797 and $0.1081, respectively.
From a technical perspective, PI shows a dominant long-term downtrend capped by a resistance trendline, connecting the June 20 and August 22 highs, around $0.0740. To reinstate a bullish trend, PI must surpass the trendline around $0.0740 and the 50-day EMA at $0.0797, opening the path toward the $0.1000 psychological mark.
Momentum is weak, with the Relative Strength Index (RSI) around 41, hinting at subdued but not extreme bearish momentum, while the Moving Average Convergence Divergence (MACD) remains marginally negative and below the signal line, reinforcing the notion of lingering downside pressure.
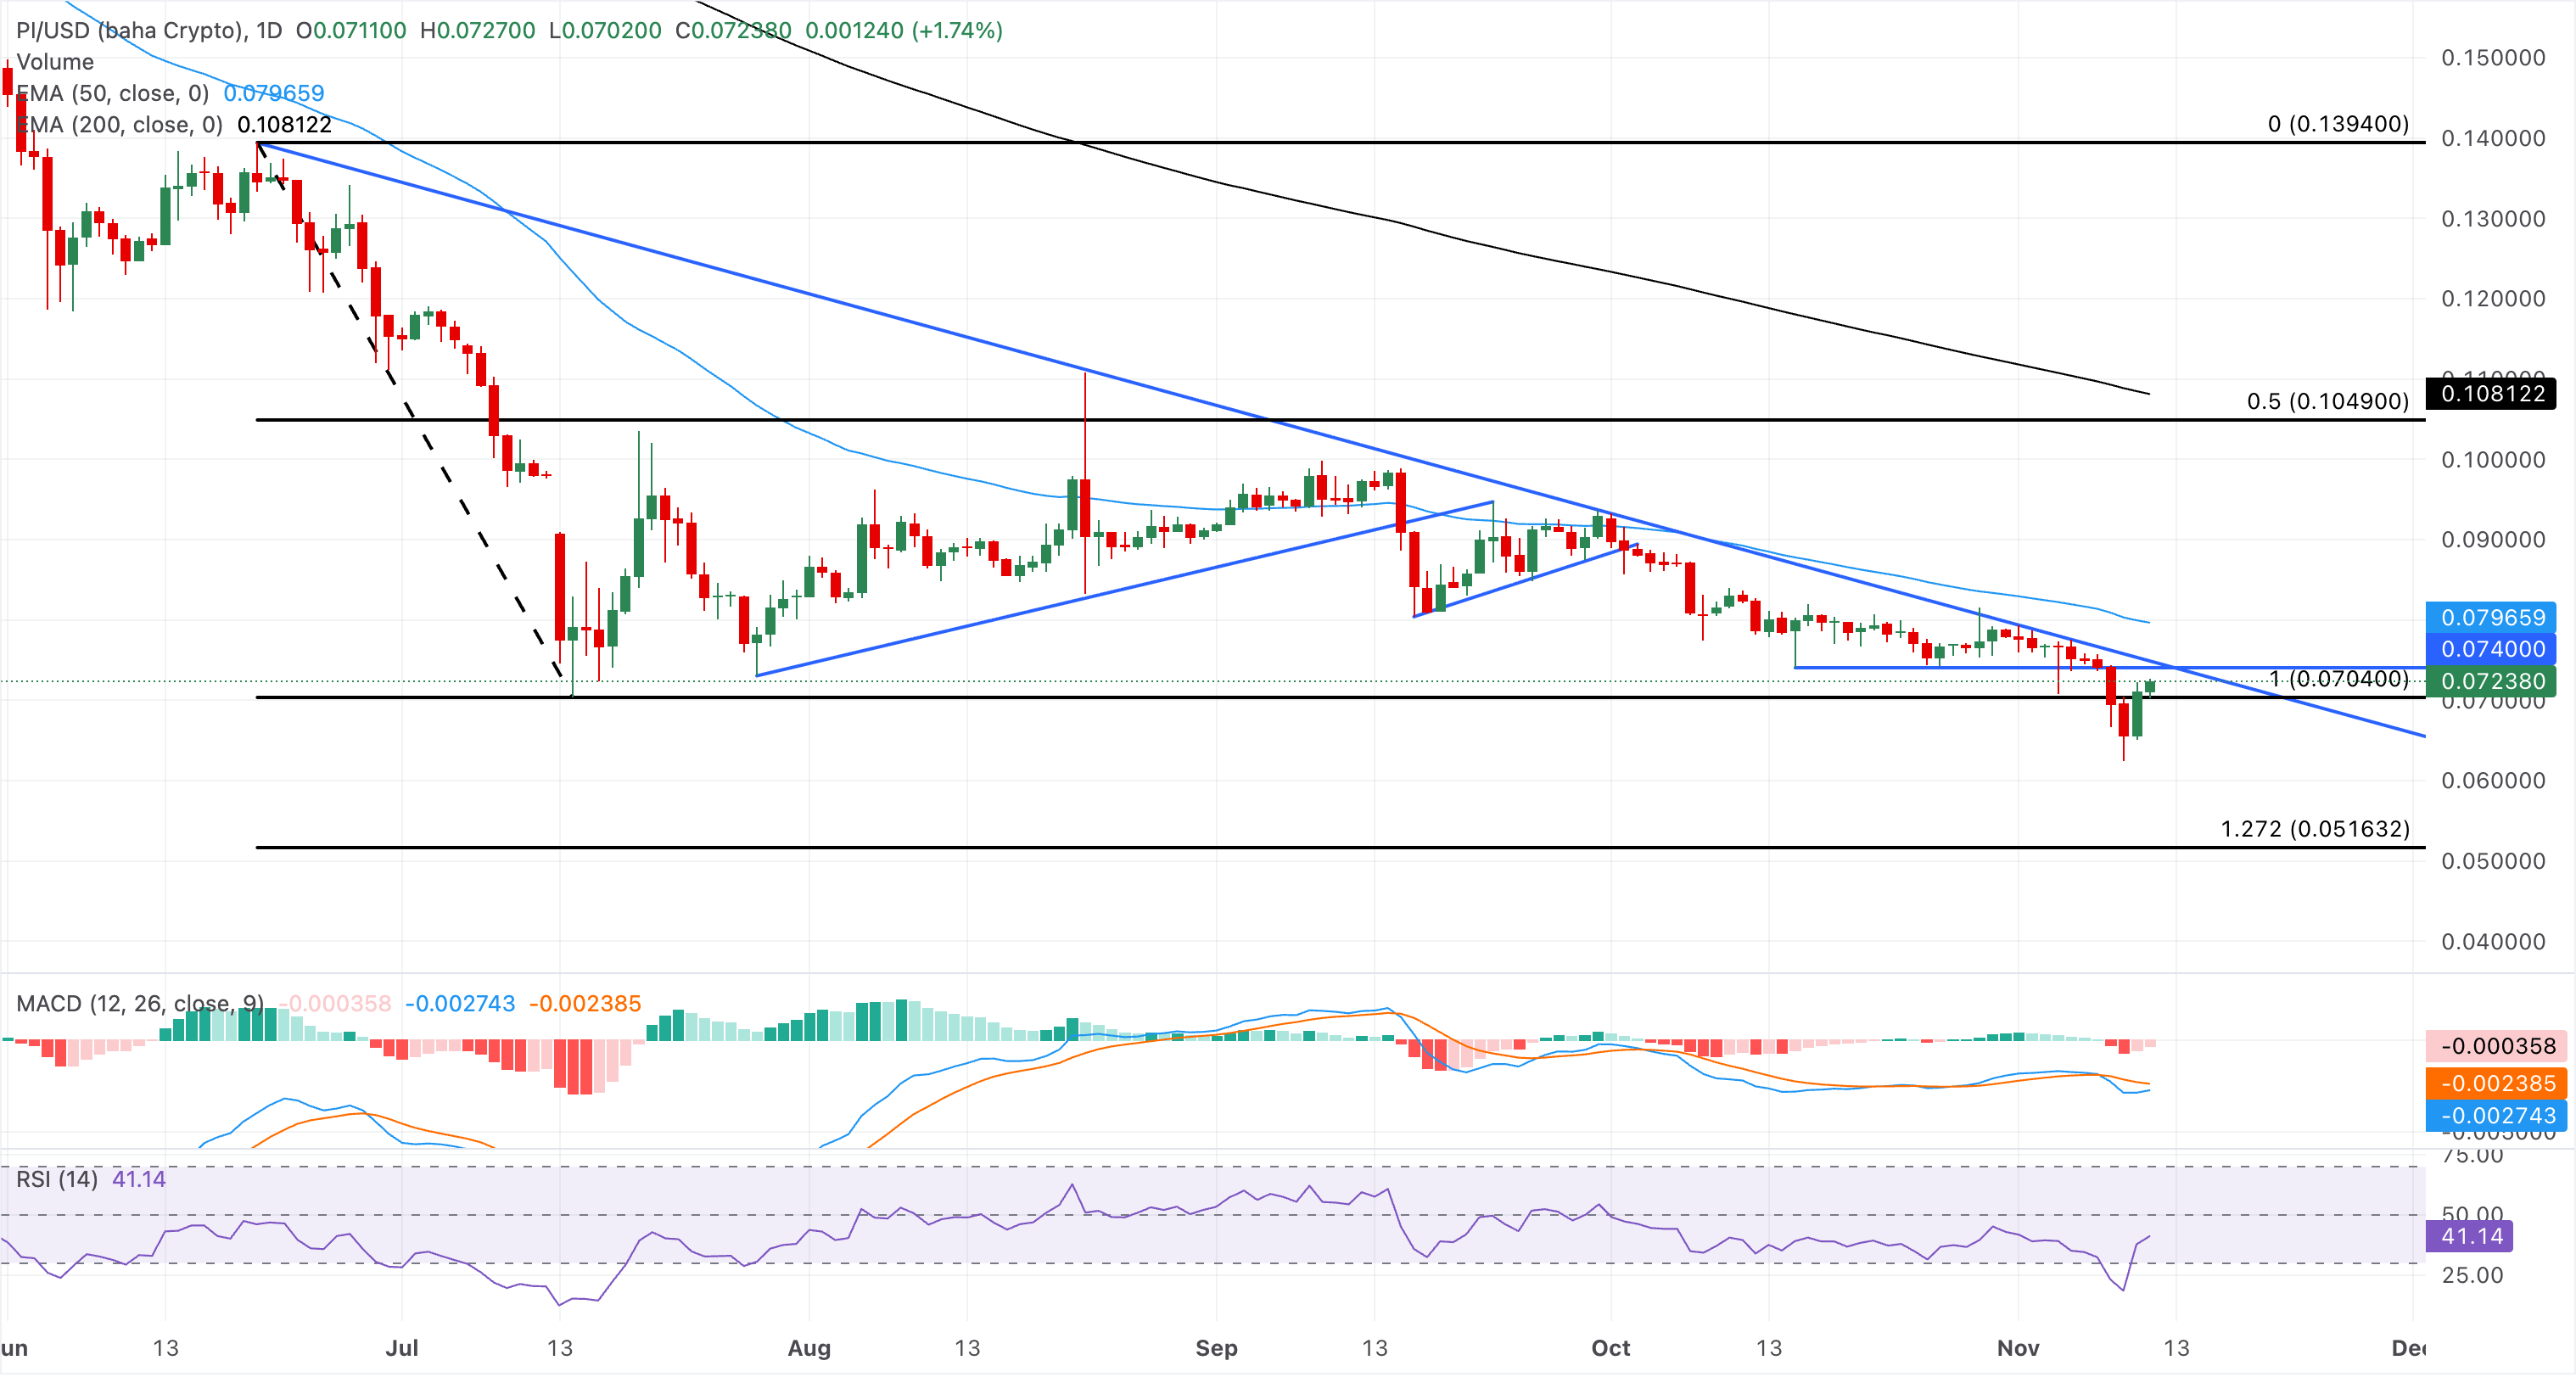
On the downside, structural support is located near the reclaimed $0.0704 support, where sellers could hesitate on the first test, followed by the 127.2% Fibonacci extension level at $0.0516, measured from $0.1394 to $0.0704.
(The technical analysis of this story was written with the help of an AI tool. Know more.)
Recommended Articles







Comments (0)
Click the $ button, enter the symbol, and select to link a stock, ETF, or other ticker.