


Pi Network Price Forecast: PI rebounds from record lows, exits oversold territory as momentum improves



- Pi Network is up around 7% on Tuesday after hitting a record low of $0.0624 the previous day.
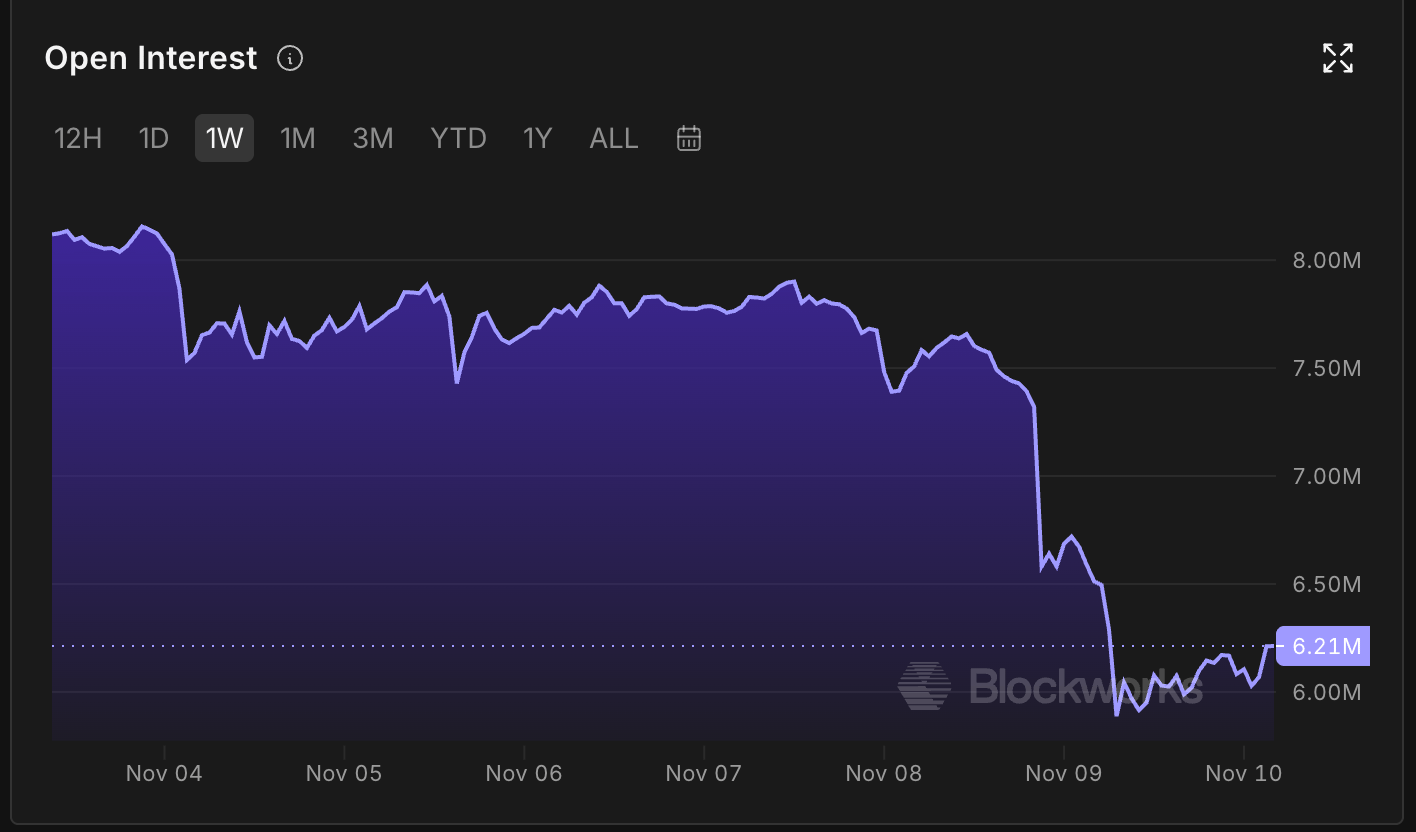
- Pi futures Open Interest rises to $6.21 million, pointing to increased positioning in the derivatives market.
- The technical outlook for PI is mixed, with the daily RSI recovering above 30 after entering oversold territory.
Pi Network (PI) shows a strong recovery on Tuesday, up over 7% after recording its all-time low of $0.0624 the previous day. PI token’s appeal in the derivatives market shows minor improvement, with Open Interest rising to $6.21 million. The technical outlook for PI remains mixed, with the price still capped below a long-term resistance trendline.
Recovering Open Interest eases short-term risk
Pi Network shows signs of regaining ground in the derivatives market. Blockworks data shows the PI token Open Interest (OI) rises to $6.21 million, from $5.89 million the previous day, indicating a near-term positional buildup and a firm rebound in sentiment.
Technical outlook: Can PI regain lost levels?
Pi Network trades at $0.0703 at press time on Tuesday, reflecting a rebound after five straight days of losses. The price holds well below the 50-day and 200-day Exponential Moving Averages (EMAs) at $0.0799 and $0.1085, respectively, and is capped by a long-term resistance trendline connecting the June 20 and August 22 highs at around $0.0752. A sustained recovery in PI could face its initial resistance at the descending trendline near $0.0752, followed by the 50-day EMA at $0.0799.
The Relative Strength Index (RSI) around 35 suggests weakness but also a rebound from oversold conditions, while the Moving Average Convergence Divergence (MACD) remains in negative territory, hinting that downside momentum could still outweigh recovery attempts.
Looking down, the immediate support for PI aligns with the 127.2% Fibonacci extension level, measured over the downswing from $0.1394 to $0.0704, at $0.0516.
(The technical analysis of this story was written with the help of an AI tool. Know more.)
Recommended Articles








Comments (0)
Click the $ button, enter the symbol, and select to link a stock, ETF, or other ticker.