


Pepe Price Forecast: PEPE signals trend reversal amid a short squeeze



- Pepe is up 10% on Tuesday, advancing the 19% gains from the previous day and last week’s 18% rise.
- Derivatives data signals renewed demand amid a short squeeze of over $2 million over the last 24 hours.
- The technical outlook for PEPE is bullish as the price surpasses a long-term resistance trendline.
Pepe (PEPE) price is up nearly 30% in the last 24 hours, outperforming most top cryptocurrencies and hinting at further upside potential. Derivatives data suggest a short squeeze of more than $2 million during the same period, forcing traders to buy back positions in the meme coin. The technical outlook for PEPE indicates an upside bias as bullish momentum strengthens.
Short squeeze triggers Pepe rally
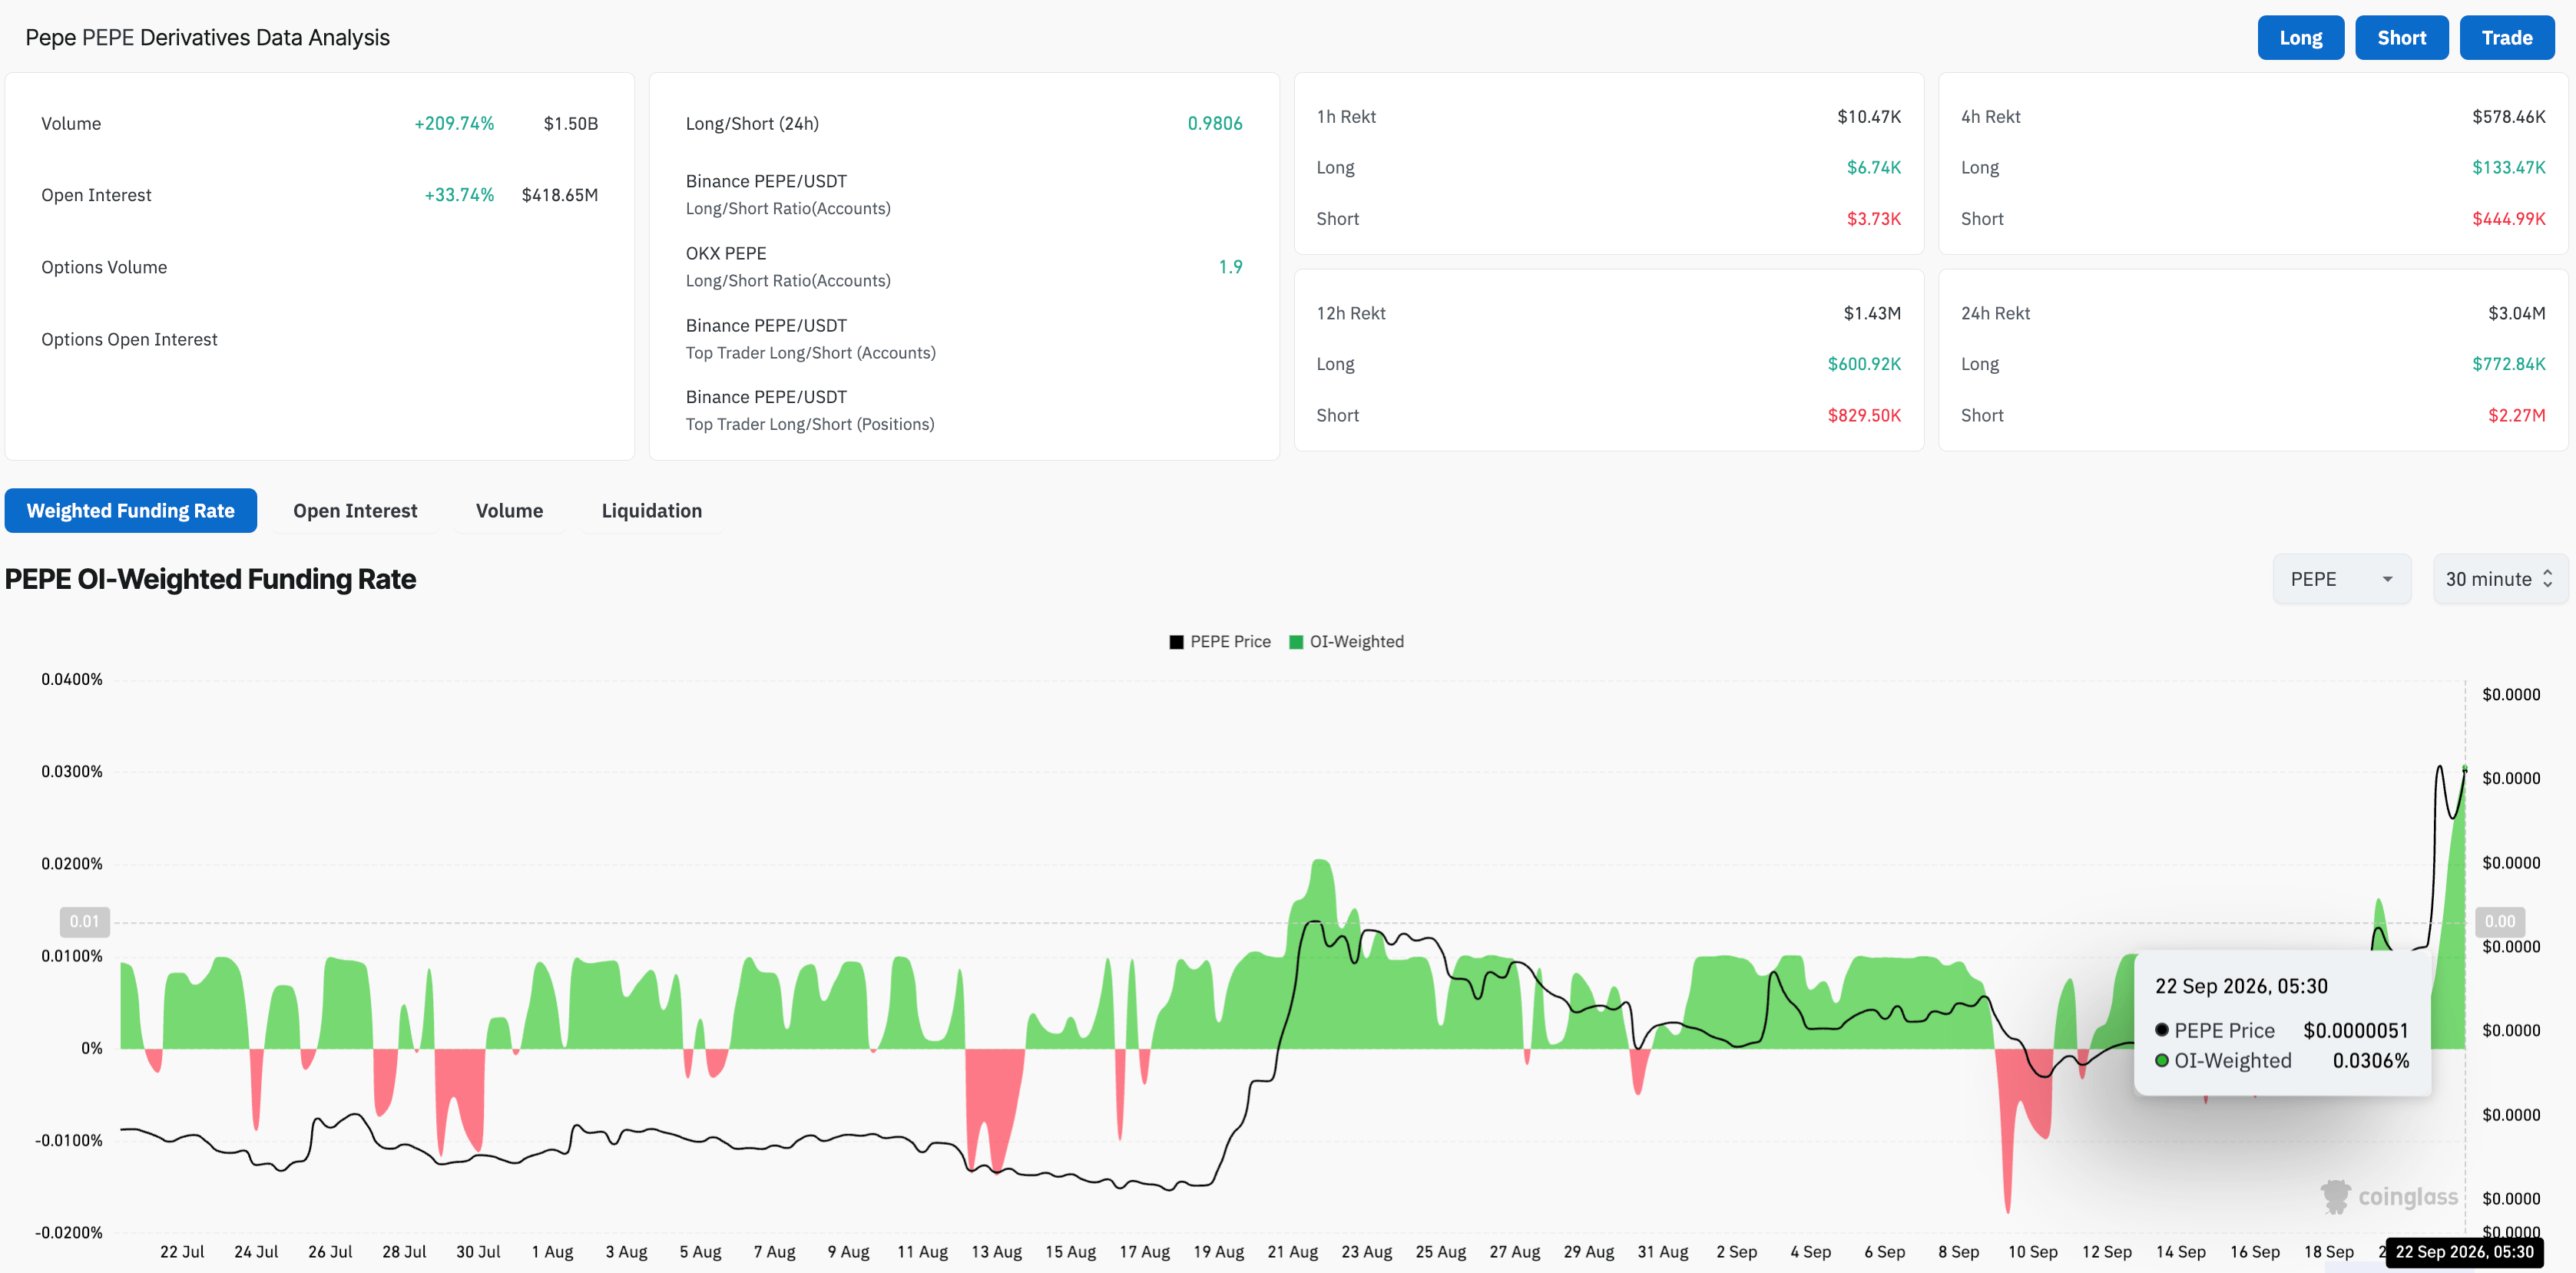
Pepe extends double-digit gains so far this week, advancing its 18% rise from last week. CoinGlass data shows that of the $3.04 million in total liquidation over 24 hours, $2.27 million came from short positions. This indicates that bearish bets on the meme coin failed, leading to a buyback.
The positive feedback drove PEPE futures Open Interest (OI) up more than 30% in the same period to $418.65 million, while trading volume surged by over 200% to $1.50 billion. This indicates strong retail participation, which typically fuels a bull run in meme coins.
A sharp spike in the PEPE funding rate of 0.0306% indicates a surge in traders’ demand to buy long positions, even at a premium, likely driven by the short-squeeze buyback.
Technical outlook: Is Pepe ready for a bullish trend reversal?
Pepe is up 10% on Tuesday, building on the 18% rise from the previous day. The meme coin is up 50% in less than 10 days, hinting at a bullish trend reversal as the broader crypto market recovers.
The rally has surpassed a long-term resistance trendline, connecting the July 22, 2025, and September 13, 2025, highs, near $0.00000414, reaffirming the trend reversal thesis. In addition, PEPE hovers above the 127.2% Fibonacci extension level, measured from $0.00000456 to $0.00000320, at $0.00000502. A confirmed breakout above this level could target the 161.8% extension level at $0.00000567.
The Relative Strength Index (RSI) at around 75 slips into overbought territory, hinting that the latest push higher in momentum may be running into exhaustion.
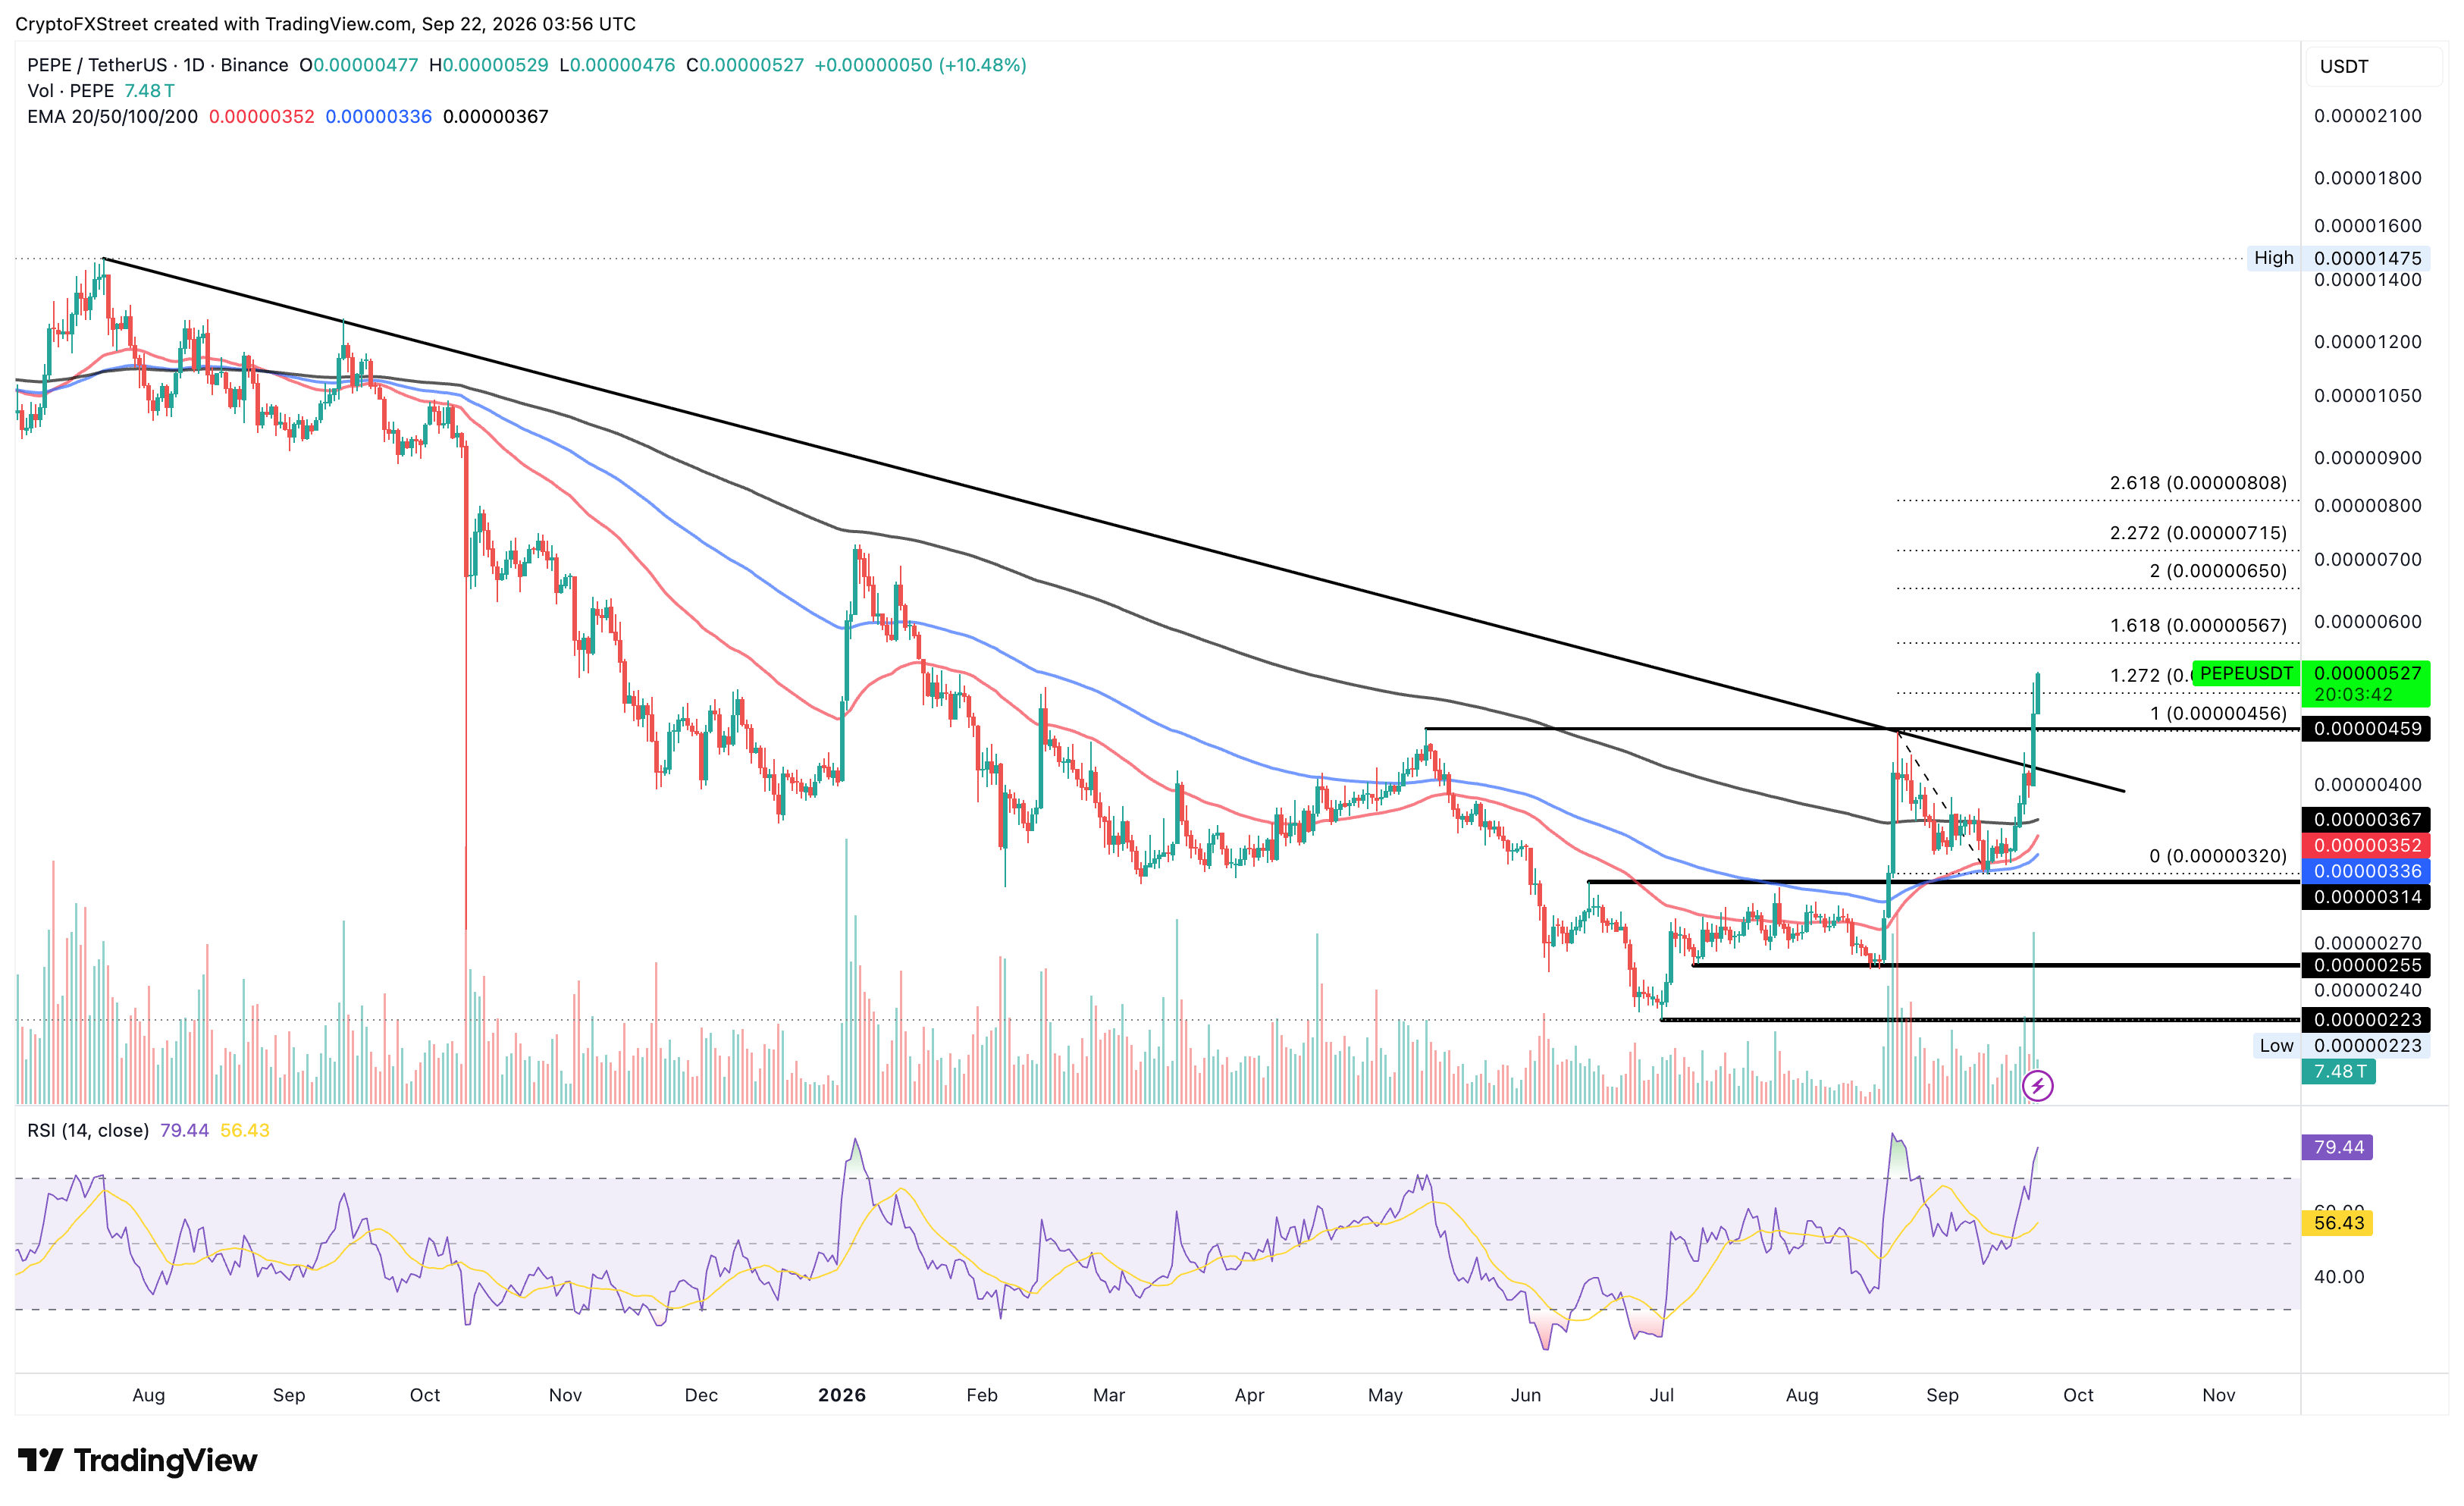
On the downside, the Fibonacci anchor at $0.00000456 and the broken trendline at $0.00000414 could serve as support levels in the event of a pullback.
(The technical analysis of this story was written with the help of an AI tool. Know more.)
Recommended Articles










Comments (0)
Click the $ button, enter the symbol, and select to link a stock, ETF, or other ticker.