


Crypto Overview: Bitcoin slips below $78,000 – DEX tokens rally



- Bitcoin consolidates near $77,000 on Monday following a 3% pullback triggered by Kevin Warsh’s inflation concerns on Friday.
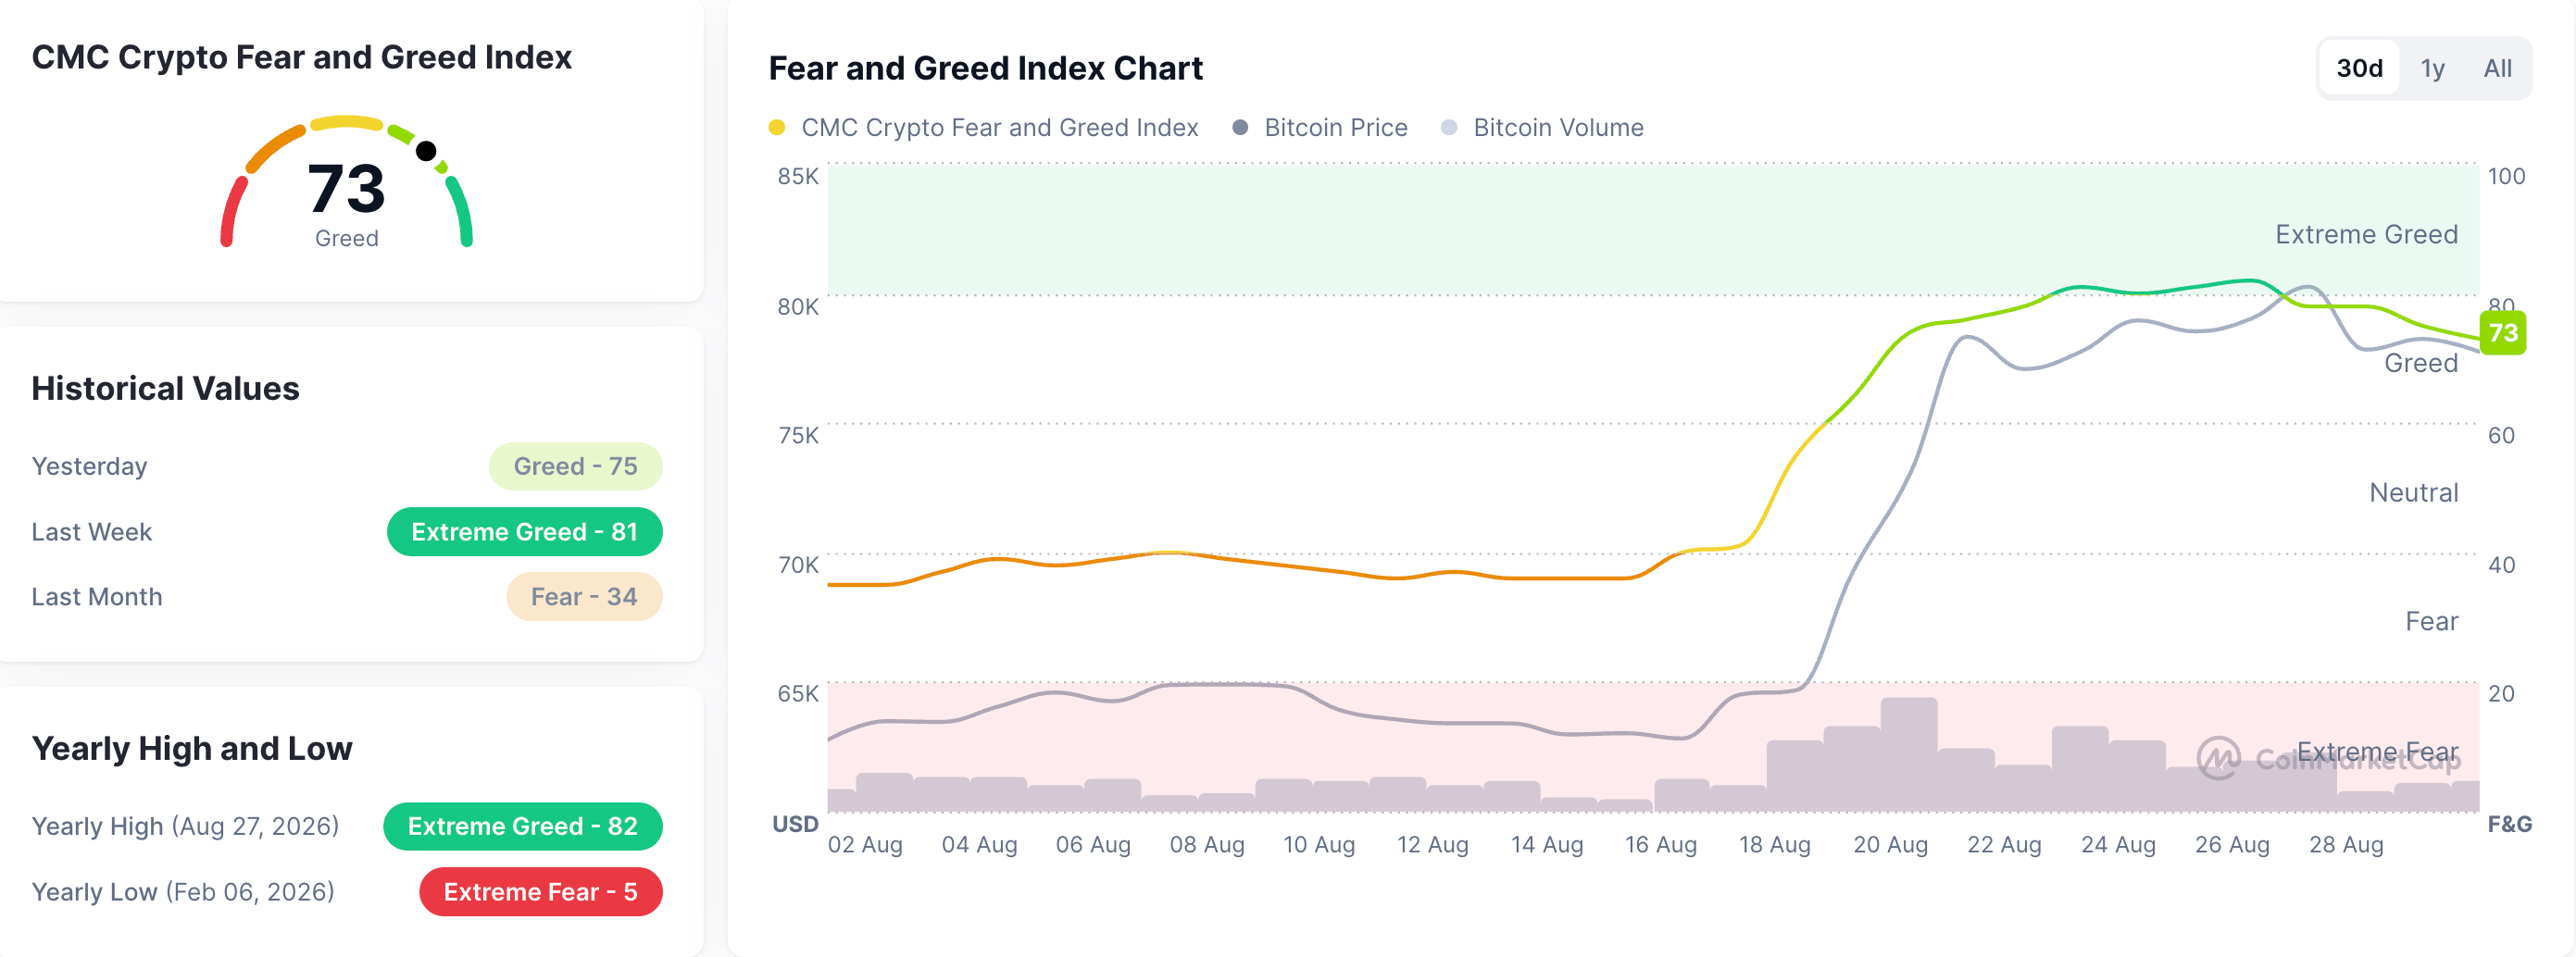
- Fear and Greed Index at 73 suggests that the crypto market sustains risk-on sentiment.
- Decentralized Exchange tokens, Uniswap and PancakeSwap, sustained gains over the last 24 hours, emerging as top performers.
Bitcoin (BTC) price is trading above $77,000 on Monday, sustaining monthly gains of over 20% so far. The technical outlook for Bitcoin is bullish as the price holds above a crucial retracement support level at $76,706 amid broader market risk-on sentiment. Decentralized Exchange (DEX) tokens, Uniswap (UNI) and PancakeSwap (CAKE), emerge as top performers over the last 24 hours, eyeing further gains.
CoinMarketCap’s Fear and Greed Index is down to 73 from 82 last week, suggesting that the crypto market is stepping off the edge amid higher Fed rate concerns.
Bitcoin holds at key support as momentum wanes
Bitcoin trades at $77,730 on Monday, maintaining a clear bullish bias as the price holds above the 78.6% retracement level of the $82,850 to $57,800 downswing, which is at $76,706. The King Crypto also holds above both the 50-day Exponential Moving Average (EMA) at $69,675 and the 200-day EMA at $72,630.
Momentum shows easing bullish pressure as the Moving Average Convergence Divergence (MACD) risks crossing below its signal line amid a waning histogram profile. At the same time, the Relative Strength Index (RSI) slips to 69 from the overbought zone, hinting that overstretched momentum is easing.
Bitcoin must clear the $82,850 resistance for a sustained upside toward the 127.2% Fibonacci extension level at $91,374.
On the downside, initial support is seen at the recently reclaimed 78.6% retracement at $77,489, ahead of a broader demand cluster formed by the 200-day EMA at $72,630 and the 50% retracement at $69,200.
DEX tokens extend gains
Uniswap trades above $5.00 at press time on Monday, sustaining its 9% gains from the previous day. UNI maintains a bullish near-term bias as price holds above the converging 50-day and 200-day EMAs at $3.94 and $4.04, hinting at a Golden Cross.
Momentum remains strong with the MACD and signal line extending positive slope, and the RSI at 71 hovering in the overbought territory, suggesting persistent upside pressure.
The immediate resistance for UNI aligns with the 127.2% Fibonacci extension level of the $2.31-$4.57 upswing, at $5.50. A confirmed breakout of this level could target the 161.8% Fibonacci extension level at $6.97.
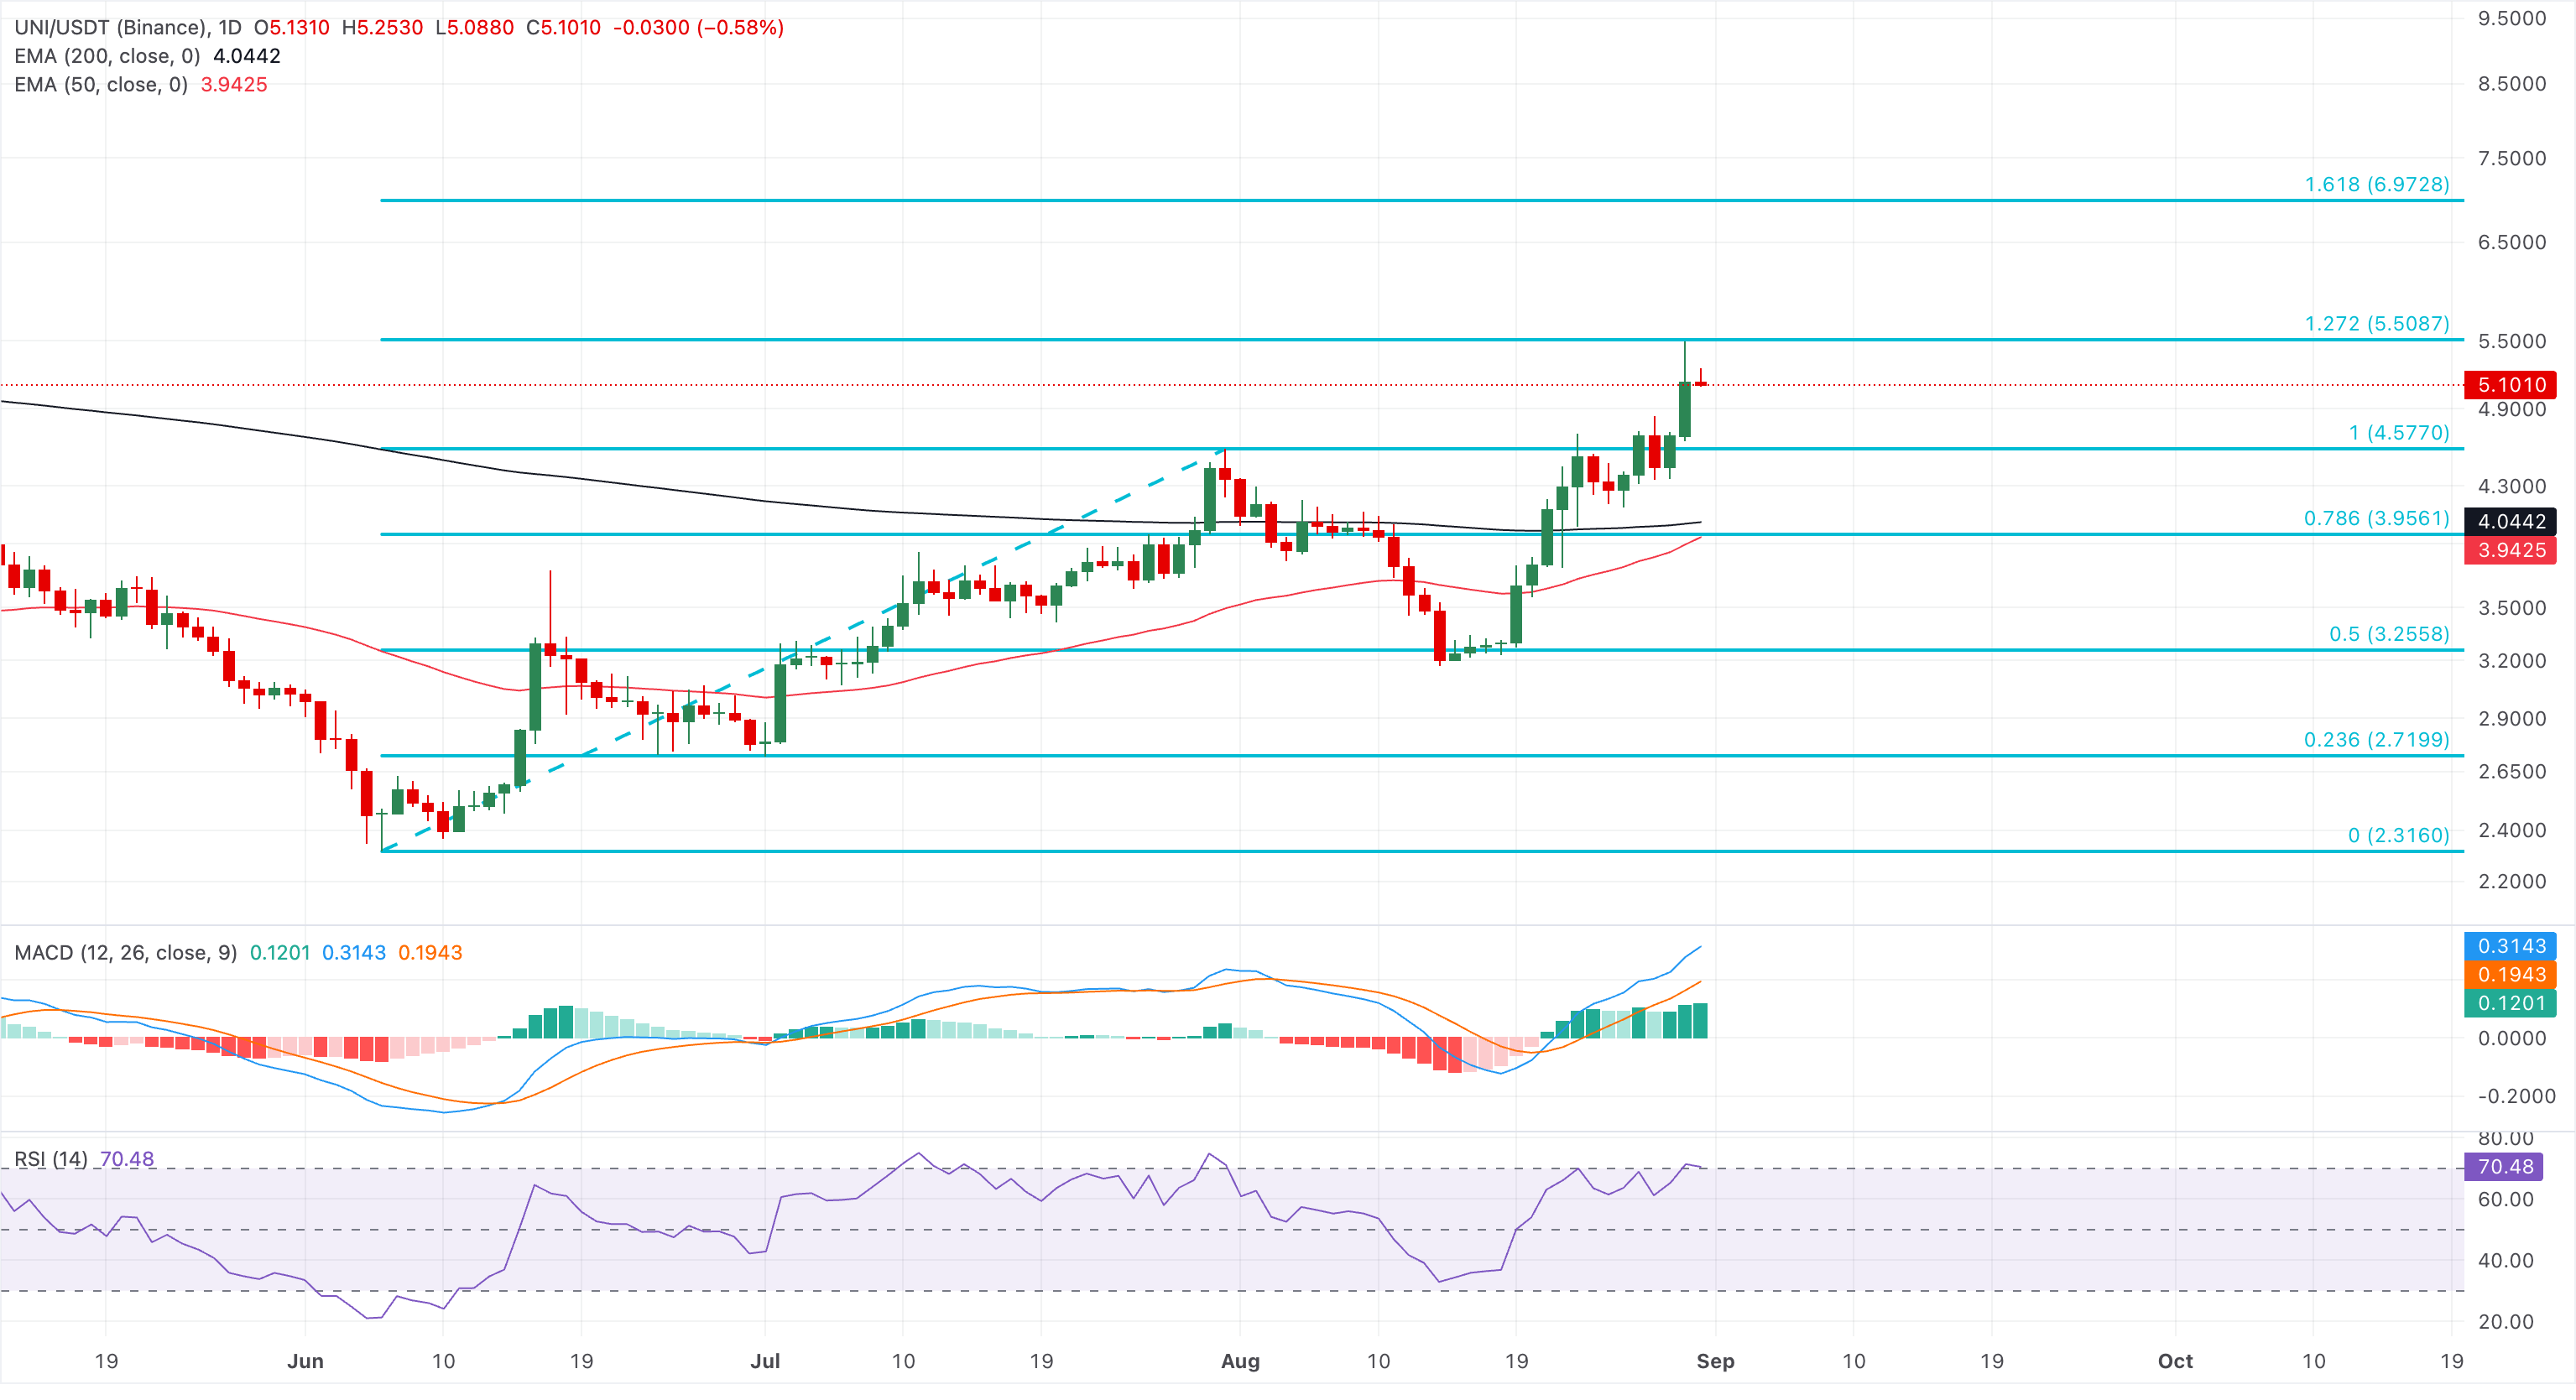
On the downside, initial support emerges at the former Fibonacci anchor near $4.57, followed by a dense structural floor around the $4.04–$3.95 area where the 200-day EMA and the 23.6% retracement converge with the 50-day EMA.
PancakeSwap hovers around $1.8100, maintaining a bullish near-term bias as price holds well above the 50-day EMA at $1.5487 and the 200-day EMA at $1.5561. This positioning of the moving average suggests a potential Golden Cross amid a bullish trend reversal.
Momentum stays constructive with the MACD and signal line rising above zero and the RSI hovering near 72, hinting at strong buying pressure but also an emerging overbought condition.
From a technical perspective, CAKE forms a flag pattern on the daily chart as price consolidates between $1.6770 and $1.8570, following the 32% rally earlier this month. A confirmed breakout above $1.8570 could extend the rally by another 32% toward $2.4600.
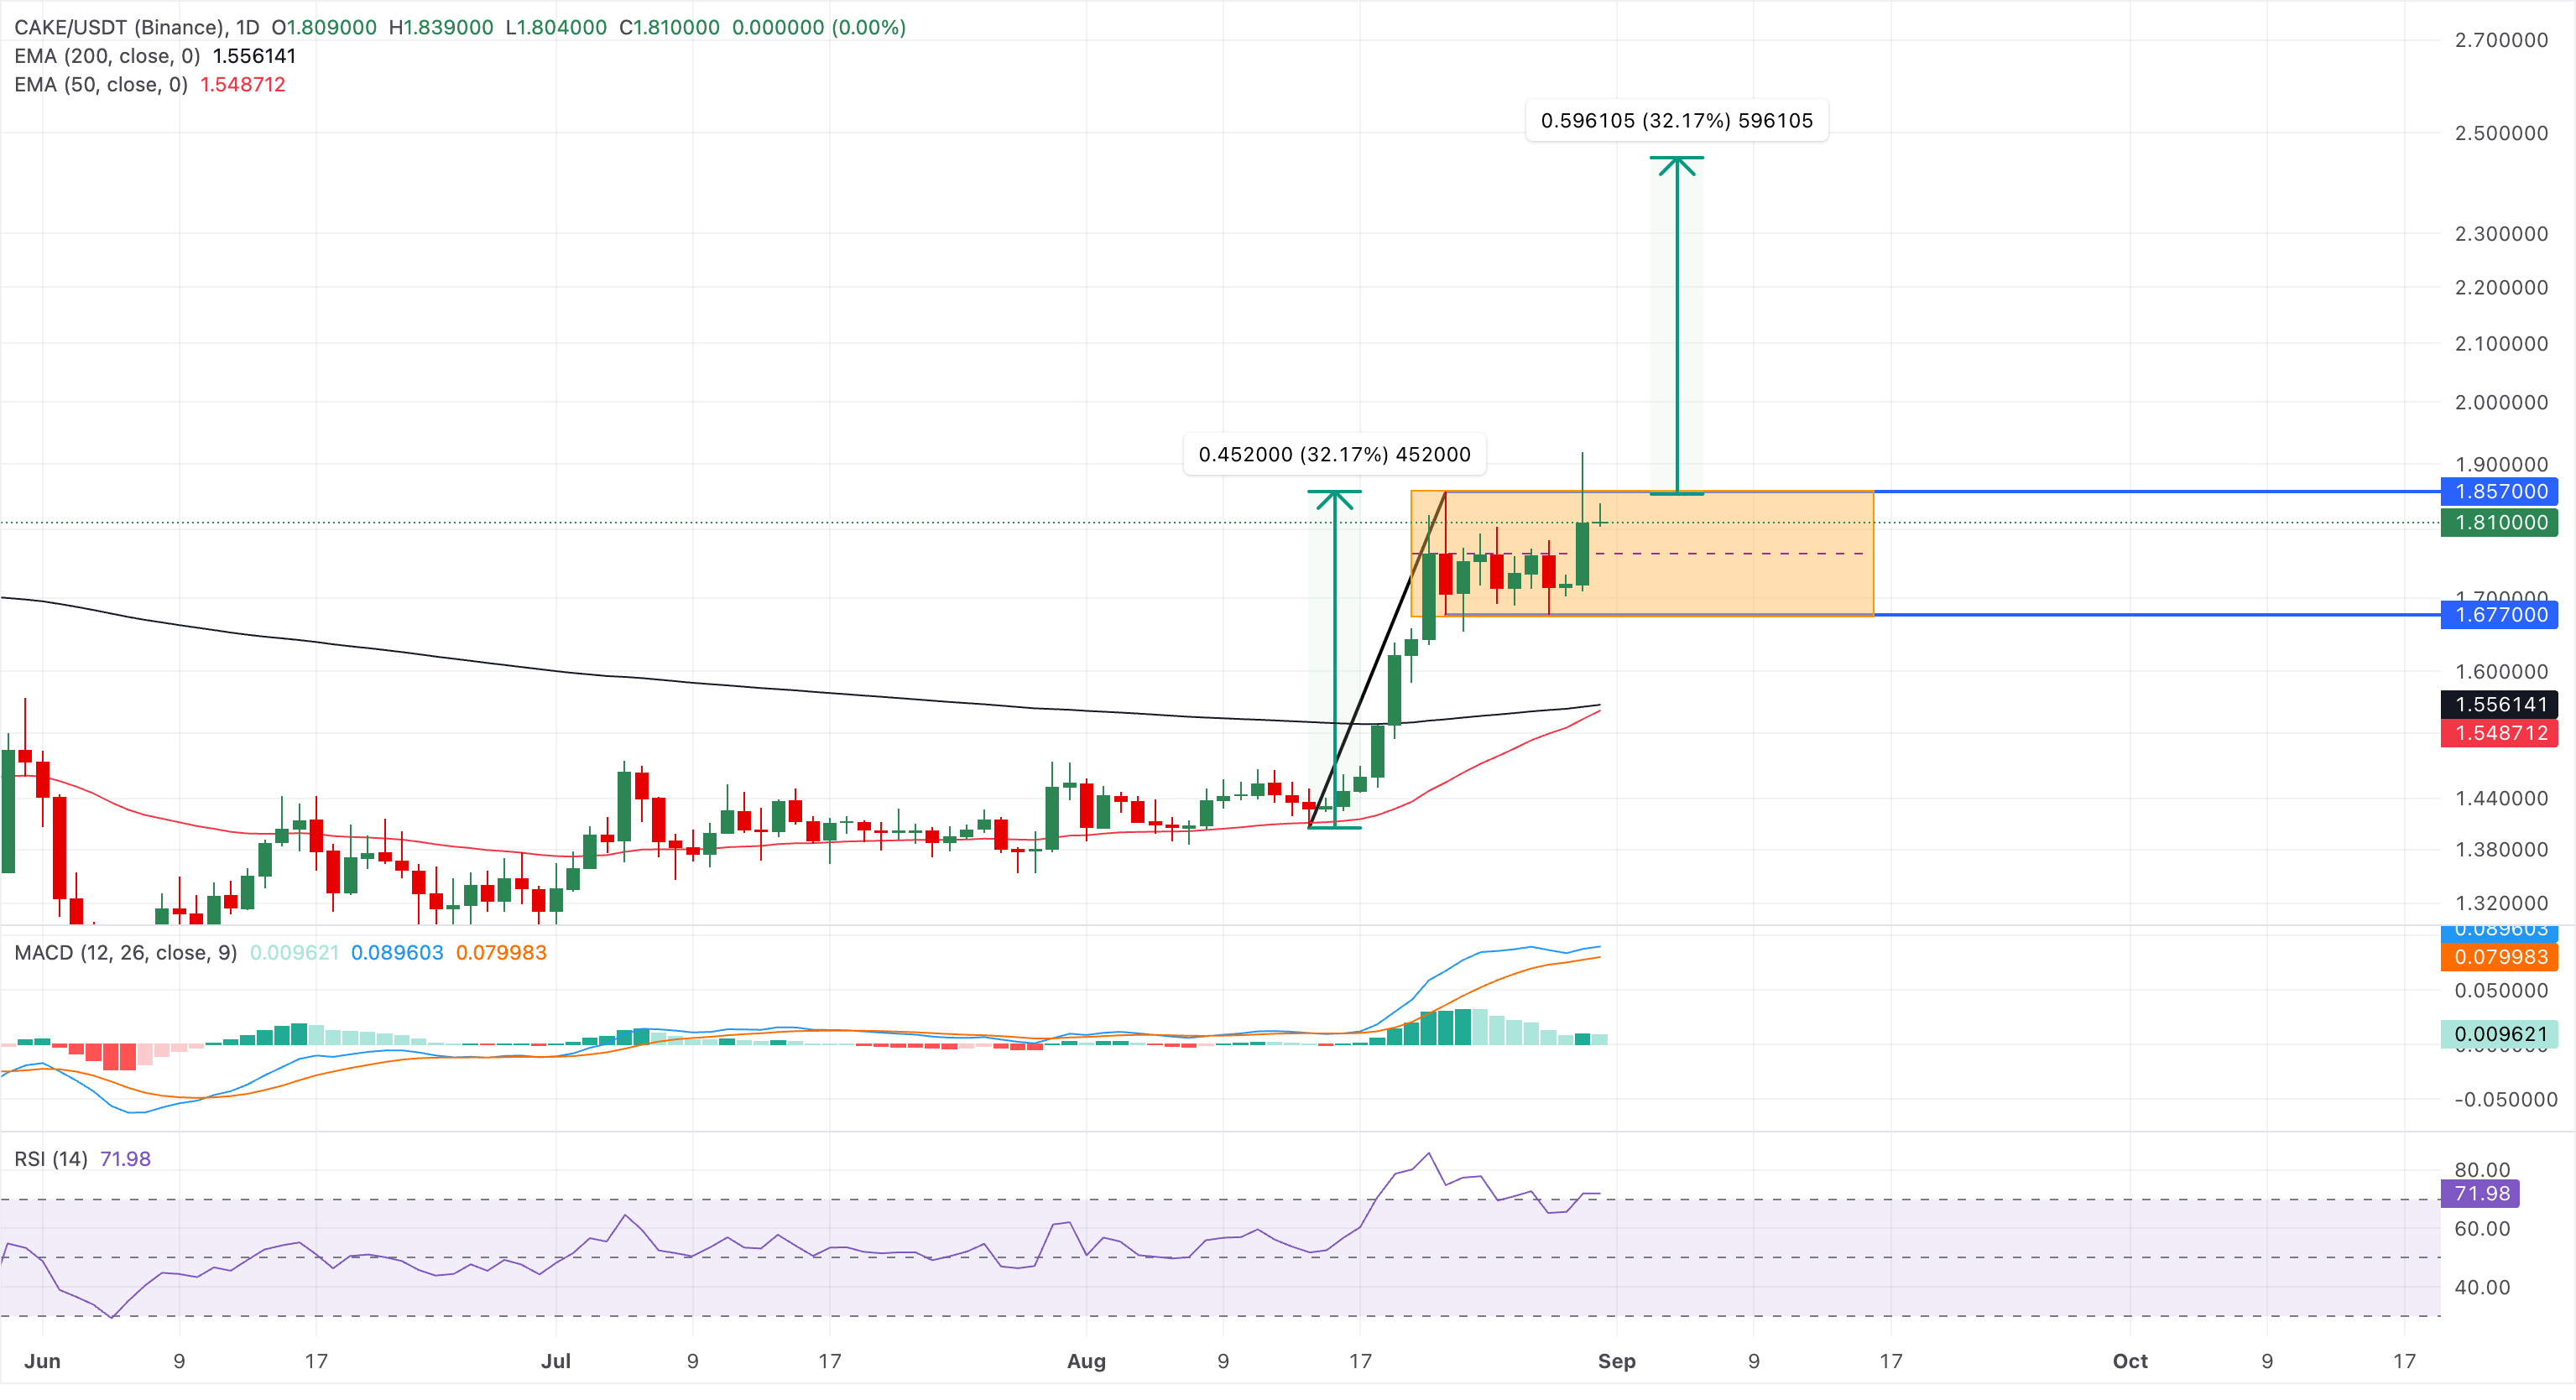
However, a corrective pullback below $1.6770 could invalidate the bullish flag pattern and potentially target the 50-day and 200-day EMAs at $1.5561 and $1.5487, where buyers are likely to reemerge to defend the prevailing bullish structure.
(The technical analysis of this story was written with the help of an AI tool. Know more.)
Recommended Articles









Comments (0)
Click the $ button, enter the symbol, and select to link a stock, ETF, or other ticker.