


Aptos Price Forecast: APT extends rebound from record low



- Aptos edges higher on Thursday, extending its recovery for the fifth consecutive day.
- Mild recovery in APT gains retail support with rising Open Interest and funding rates.
- The technical outlook is mixed, as APT nears the 50-day EMA at $0.6311, which is acting as immediate resistance.
Aptos (APT) is trading in the green on Thursday, extending its fifth consecutive day of recovery after hitting a record low of $0.5450 on Saturday. Retail demand is rising, as evidenced by increasing Open Interest and funding rates, aligning with the recent rebound. The technical outlook is mixed, as the short-term recovery remains capped below the 50-day Exponential Moving Average (EMA) at $0.6311.
Aptos regains retail strength
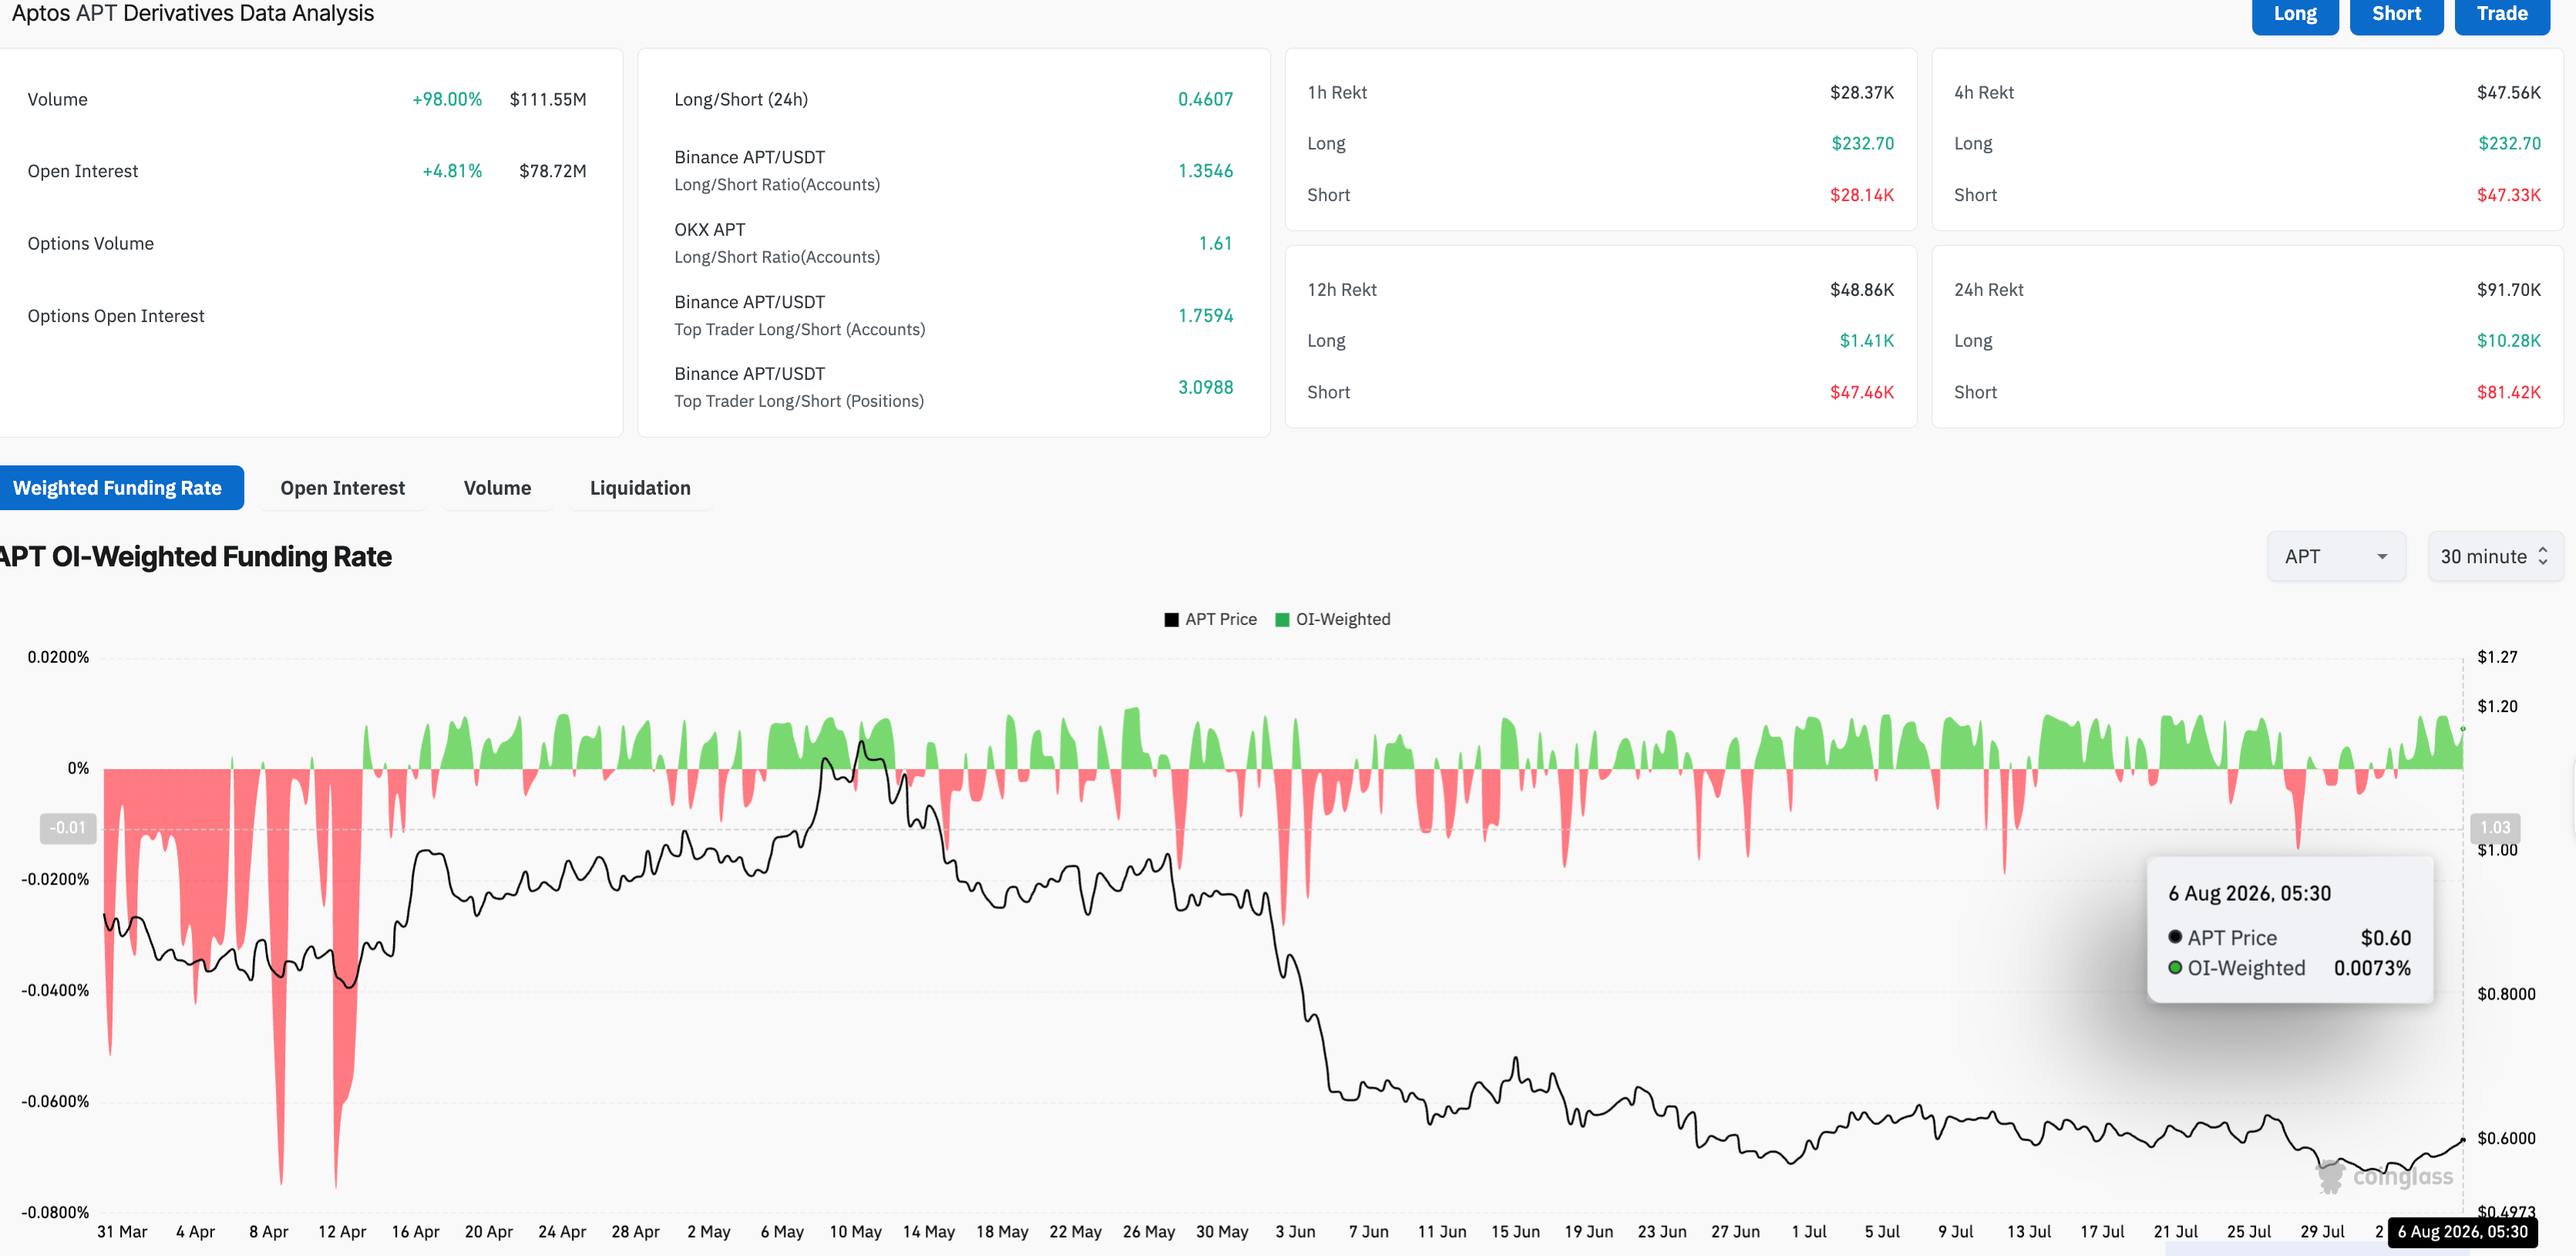
Aptos is gaining retail demand, supporting the mild recovery seen over the last five days after hitting its record low of $0.6311 on Saturday. CoinGlass data shows that APT futures Open Interest (OI) is up nearly 5% over the last 24 hours to $78.72 million, indicating an increase in the notional value of active perpetual contracts or a buildup in new positions. At the same time, funding rates have increased to 0.0073%, indicating a bullish bias among traders as trading activity rises, with volume up 98% to $111.55 million.
Technical outlook: Will Aptos regain a bullish trend?
Aptos trades near $0.6000 at press time on Thursday, extending a mild recovery amid a broader bearish tone. APT trades below the day 50-day EMA at $0.6310 and the longer-term 200-day EMA at $1.1276.
From a technical perspective, the price remains below the downtrend resistance line at $0.6198, reinforcing the bearish bias despite some improving momentum. A decisive close above this trendline and the 50-day EMA at $0.6310 could reinstate an upward trend toward the overhead supply zone near $0.8000.
The Moving Average Convergence Divergence (MACD) has crossed above the signal line, while the Relative Strength Index (RSI) at 50 rebounds to the midline from the oversold boundary, suggesting neutral-to-slightly constructive momentum.
On the downside, the record low of $0.5450 and the $0.5000 psychological threshold emerge as potential support levels.
(The technical analysis of this story was written with the help of an AI tool. Know more.)
Recommended Articles










Comments (0)
Click the $ button, enter the symbol, and select to link a stock, ETF, or other ticker.