


Aave Price Forecast: Bearish RSI divergence risks a 20% drop despite steady DeFi deposits



- Aave edges higher on Tuesday, sustaining gains above its 50-day EMA at $90.80 while RSI flashes a bearish divergence.
- Aave on Monad recorded over $500 million in deposits, with V4 deposits hitting a record high of $350 million.
- Retail demand weakens for AAVE with a 6% decline in Open Interest and sinking funding rates.
Aave (AAVE) extends a mild near-term recovery on Tuesday, holding above its 50-day Exponential Moving Average (EMA) at $90.80. Aave protocol’s V3 deployment on Monad blockchain recorded over $500 million in deposits over the last month, reflecting increased user adoption. Still, retail demand remains weak, with futures Open Interest declining by 6% over the last 24 hours and the funding rate sinking below zero.
The technical outlook for AAVE indicates a downside bias with the RSI indicator flashing a bearish divergence.
AAVE loses retail strength despite growing deposits
Aave sees increased user deposits over its V3 protocol deployed on the layer-1 blockchain Monad. Over the past month, deposits have surged by more than $500 million, with more than $215 million in active loans.
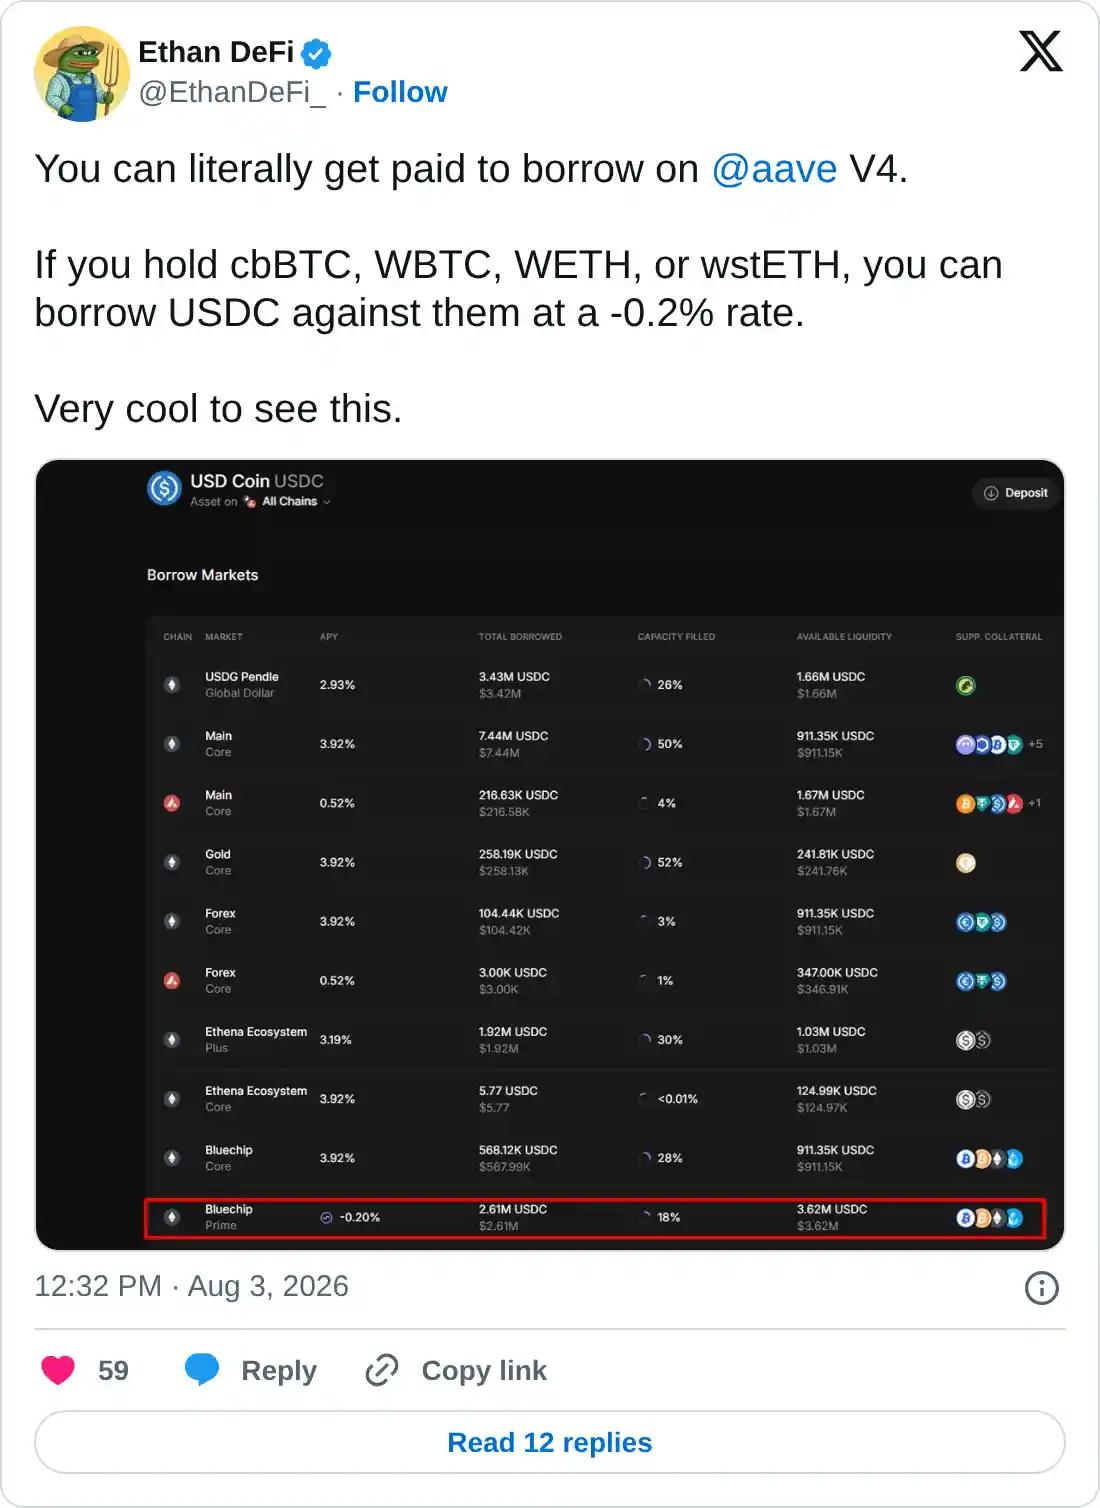
On the other hand, Aave V4 protocol deposits have surpassed $350 million, setting a new record high after adding over $100 million in the past 30 days. This surge in deposits reflects increasing user adoption, likely driven by an attractive USDC borrowing offer of -0.2% for cbBTC, WBTC, WETH, or wstETH holders.
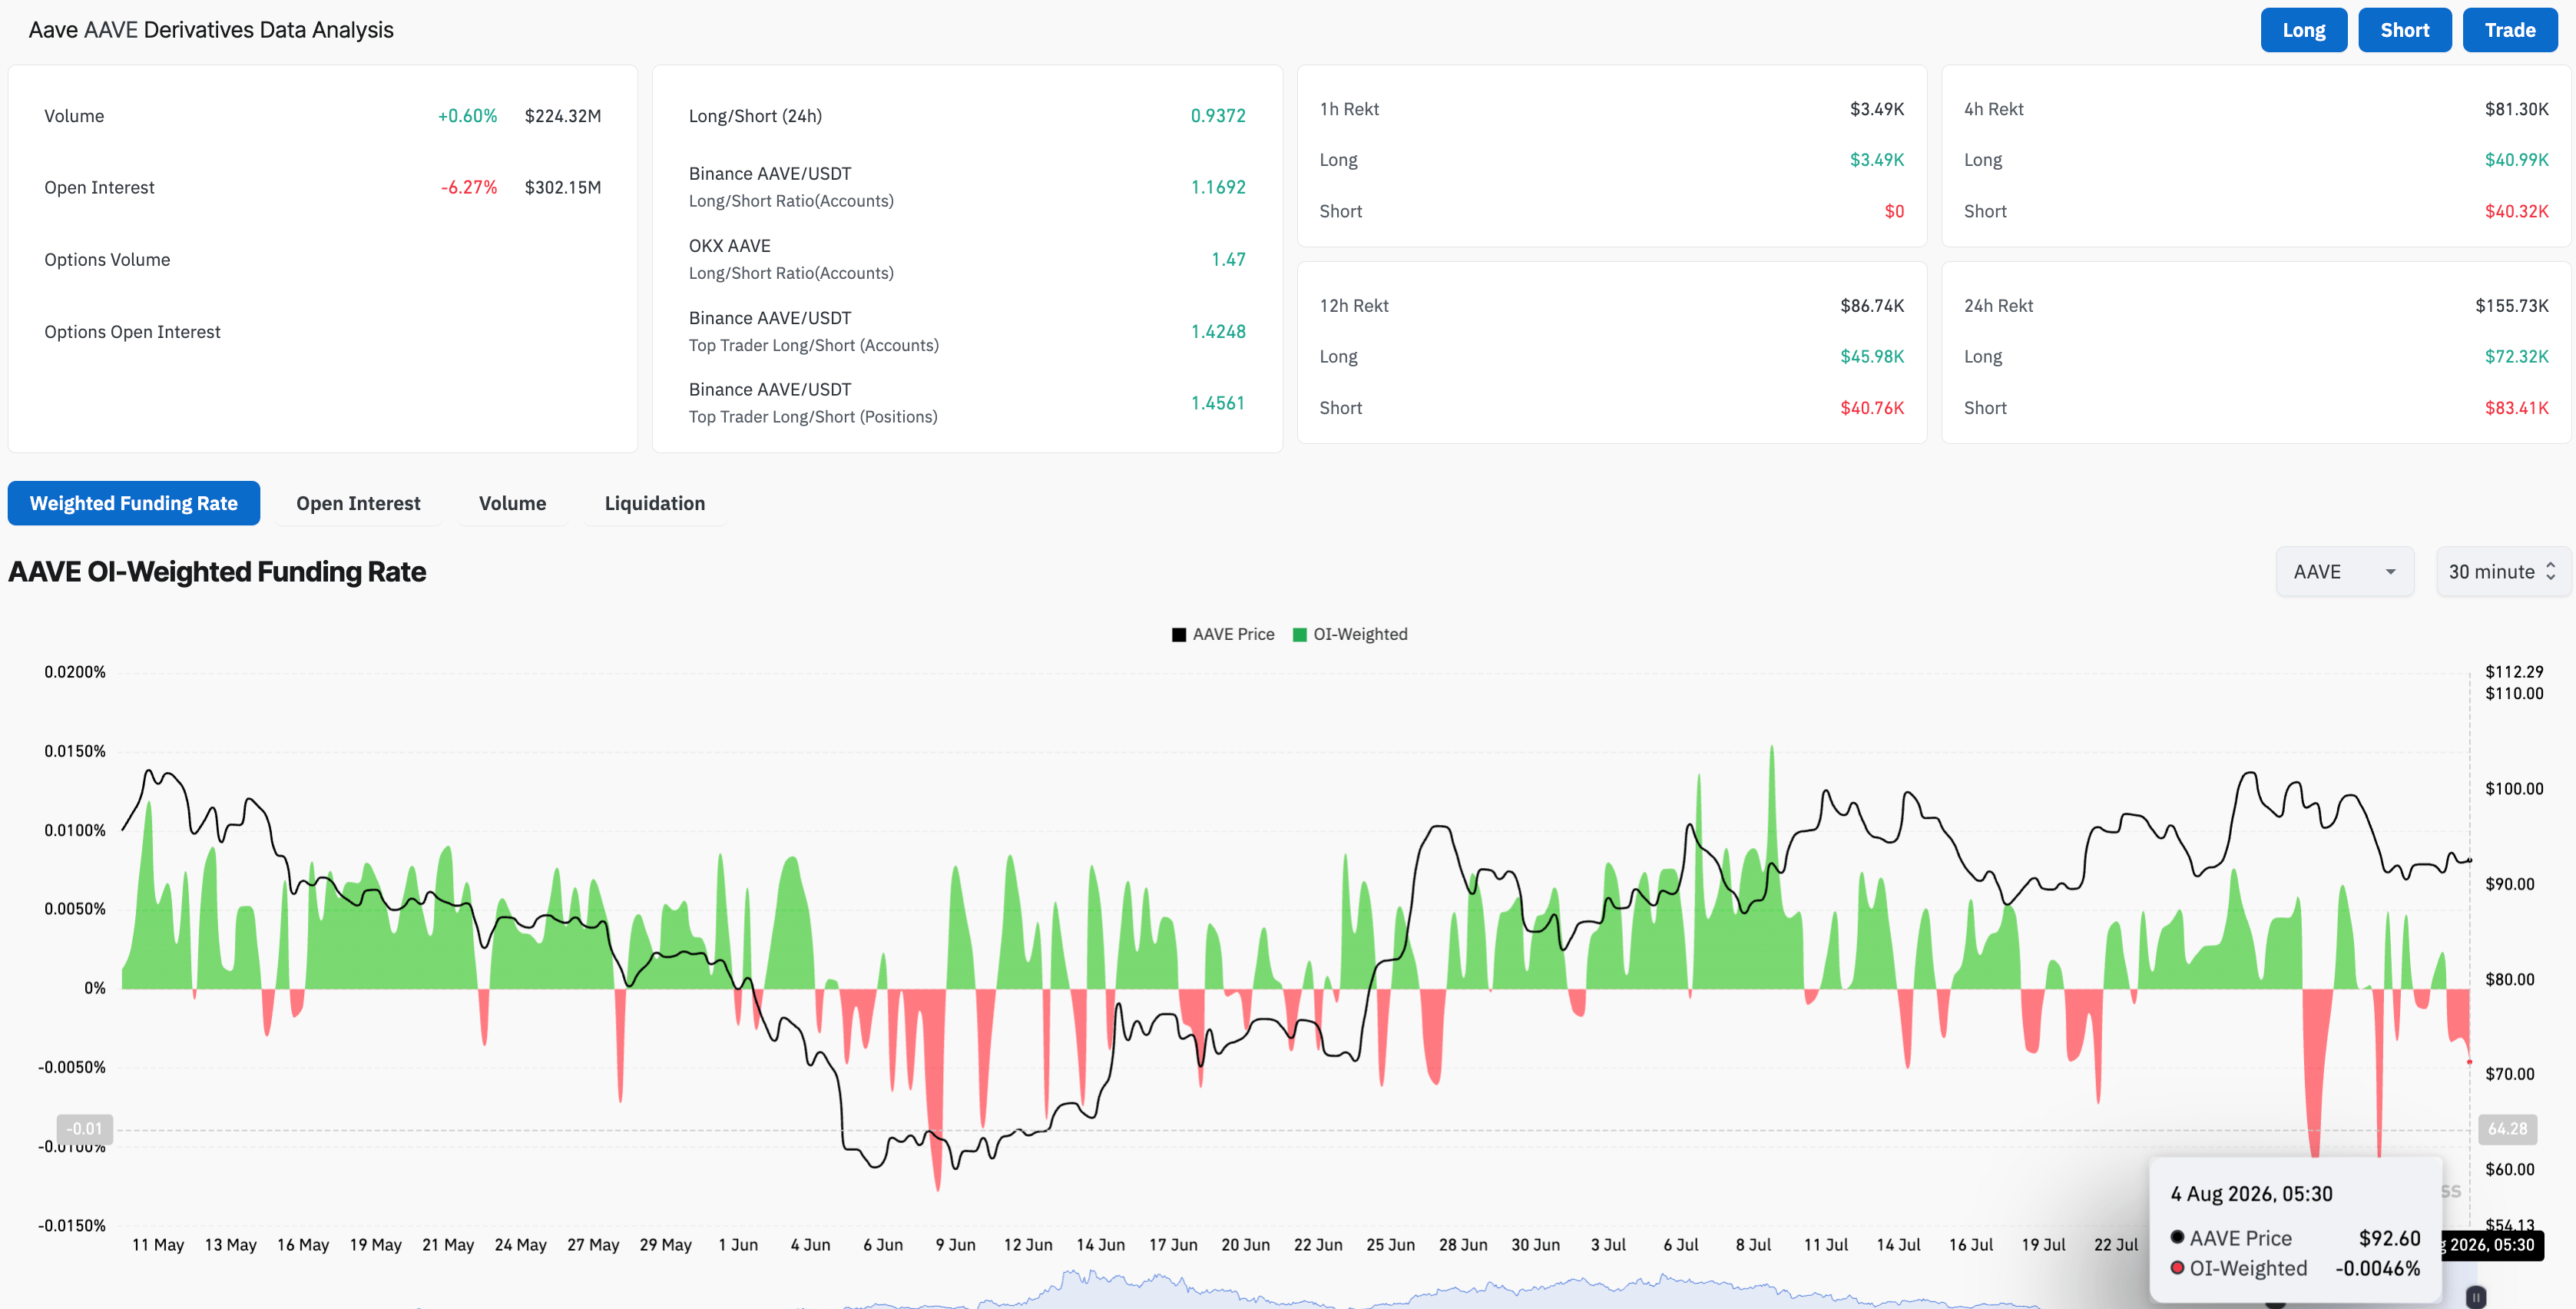
Still, AAVE loses its retail strength in the derivatives market. Coinglass data shows AAVE Open Interest (OI) is down over 6% in the last 24 hours to $302.15 million. At the same time, the funding rate has fallen below zero to -0.0046%, indicating a bearish bias among traders willing to take short positions at a premium. In addition, the long-to-short ratio over the past 24 hours is down to 0.9372, reaffirming a greater number of active short contracts.
Technical outlook: Will AAVE price drop to $70?
AAVE hovers above $90 at press time on Tuesday, maintaining a constructive near-term bias above the 50-day EMA at $90.80. Still, the DeFi token is trading well below the longer-term 200-day EMA at $112.75, suggesting broader upside remains capped for now.
The Moving Average Convergence Divergence (MACD) continues to decline below its signal line, indicating firm bearish momentum. At the same time, the Relative Strength Index (RSI) is at 49 with a declining trend while the price forms a minor upward trend, confirming a bearish divergence, hinting at subdued momentum.
Looking down, a decisive close below the 50-day EMA at $90.80 could extend the decline by roughly 20% toward the June 18 low at $70.65.
On the topside, the $100 psychological threshold, near the May 10 high of $103.51, emerges as the next meaningful resistance, where a sustained break above this zone would strengthen the bullish case. Beyond this, the 200-day EMA at $112.75 would serve as the overhead resistance.
(The technical analysis of this story was written with the help of an AI tool. Know more.)
Recommended Articles








Comments (0)
Click the $ button, enter the symbol, and select to link a stock, ETF, or other ticker.