


Crypto Market Overview: Bitcoin recovery eases – HBAR and LDO test key resistance zones



- Bitcoin edges lower on Thursday, holding above its 50-day EMA at $65,167.
- Hedera holds firm above $0.073 following a 4% surge the previous day.
- Lido DAO tests bullish breakout of the 200-day EMA at $0.4095, with 12% gains so far this week.
Bitcoin (BTC) edges below $66,000 on Thursday, extending the previous day's losses. Hedera (HBAR) and Lido DAO (LDO) sustain bullish momentum, testing the breakout of a crucial resistance zone to extend their rally.
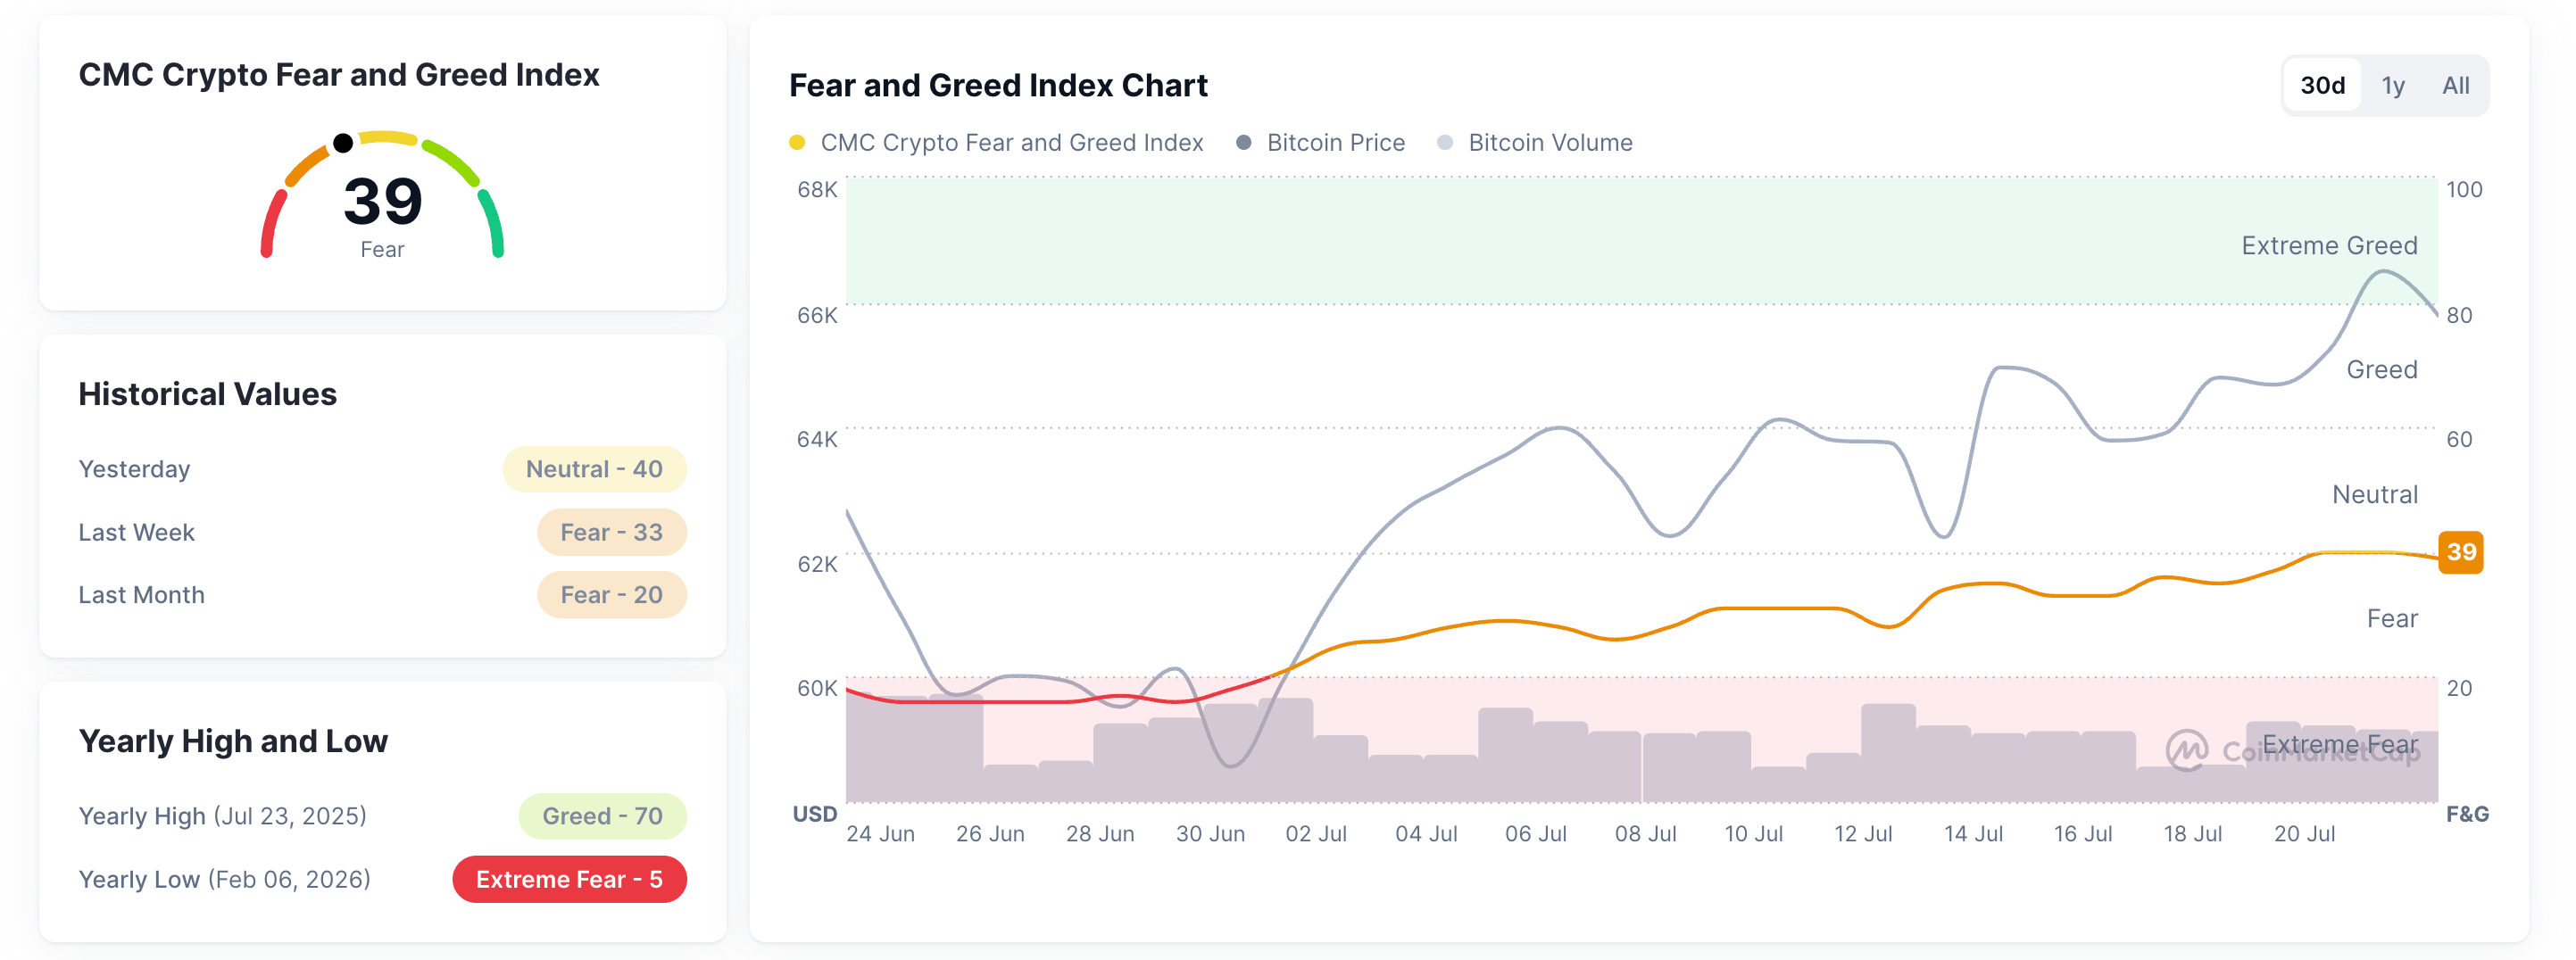
CoinMarketCap’s Fear and Greed Index at 39 stalls below the neutral territory, indicating that sellers remain dominant.
Bitcoin could retest its 50-day EMA
Bitcoin is edging lower toward the 50-day Exponential Moving Average (EMA) at $65,167, but maintains a constructive near-term tone. From a technical perspective, BTC remains capped below the key resistance level at $67,516. A decisive close above this could reinstate a recovery toward the 200-day EMA at $74,214.
Momentum indicators support this bias, with the Relative Strength Index (RSI) at 58 holding a broadly upward trend and the Moving Average Convergence Divergence (MACD) and its signal line staying above zero, suggesting ongoing bullish pressure rather than exhaustion.
On the downside, initial support is located at the 50-day EMA at $65,167, and holding above this moving average would keep the broader bullish bias intact. However, a sustained break below it would expose a deeper corrective phase toward $60,000.
Hedera and Lido DAO face headwinds
Hedera shows early signs of bullish bias in the near term as price tests the 50-day EMA at $0.0745, which sits well below the 200-day EMA at $0.0958. A breakout of the 50-day EMA at $0.0745 could extend the rally toward the R1 Pivot level at $0.0888.
Despite this capped structure, momentum has improved: the RSI has firmed to around 56, while the MACD and signal line rise with the histogram expanding, suggesting that downside pressure is easing.
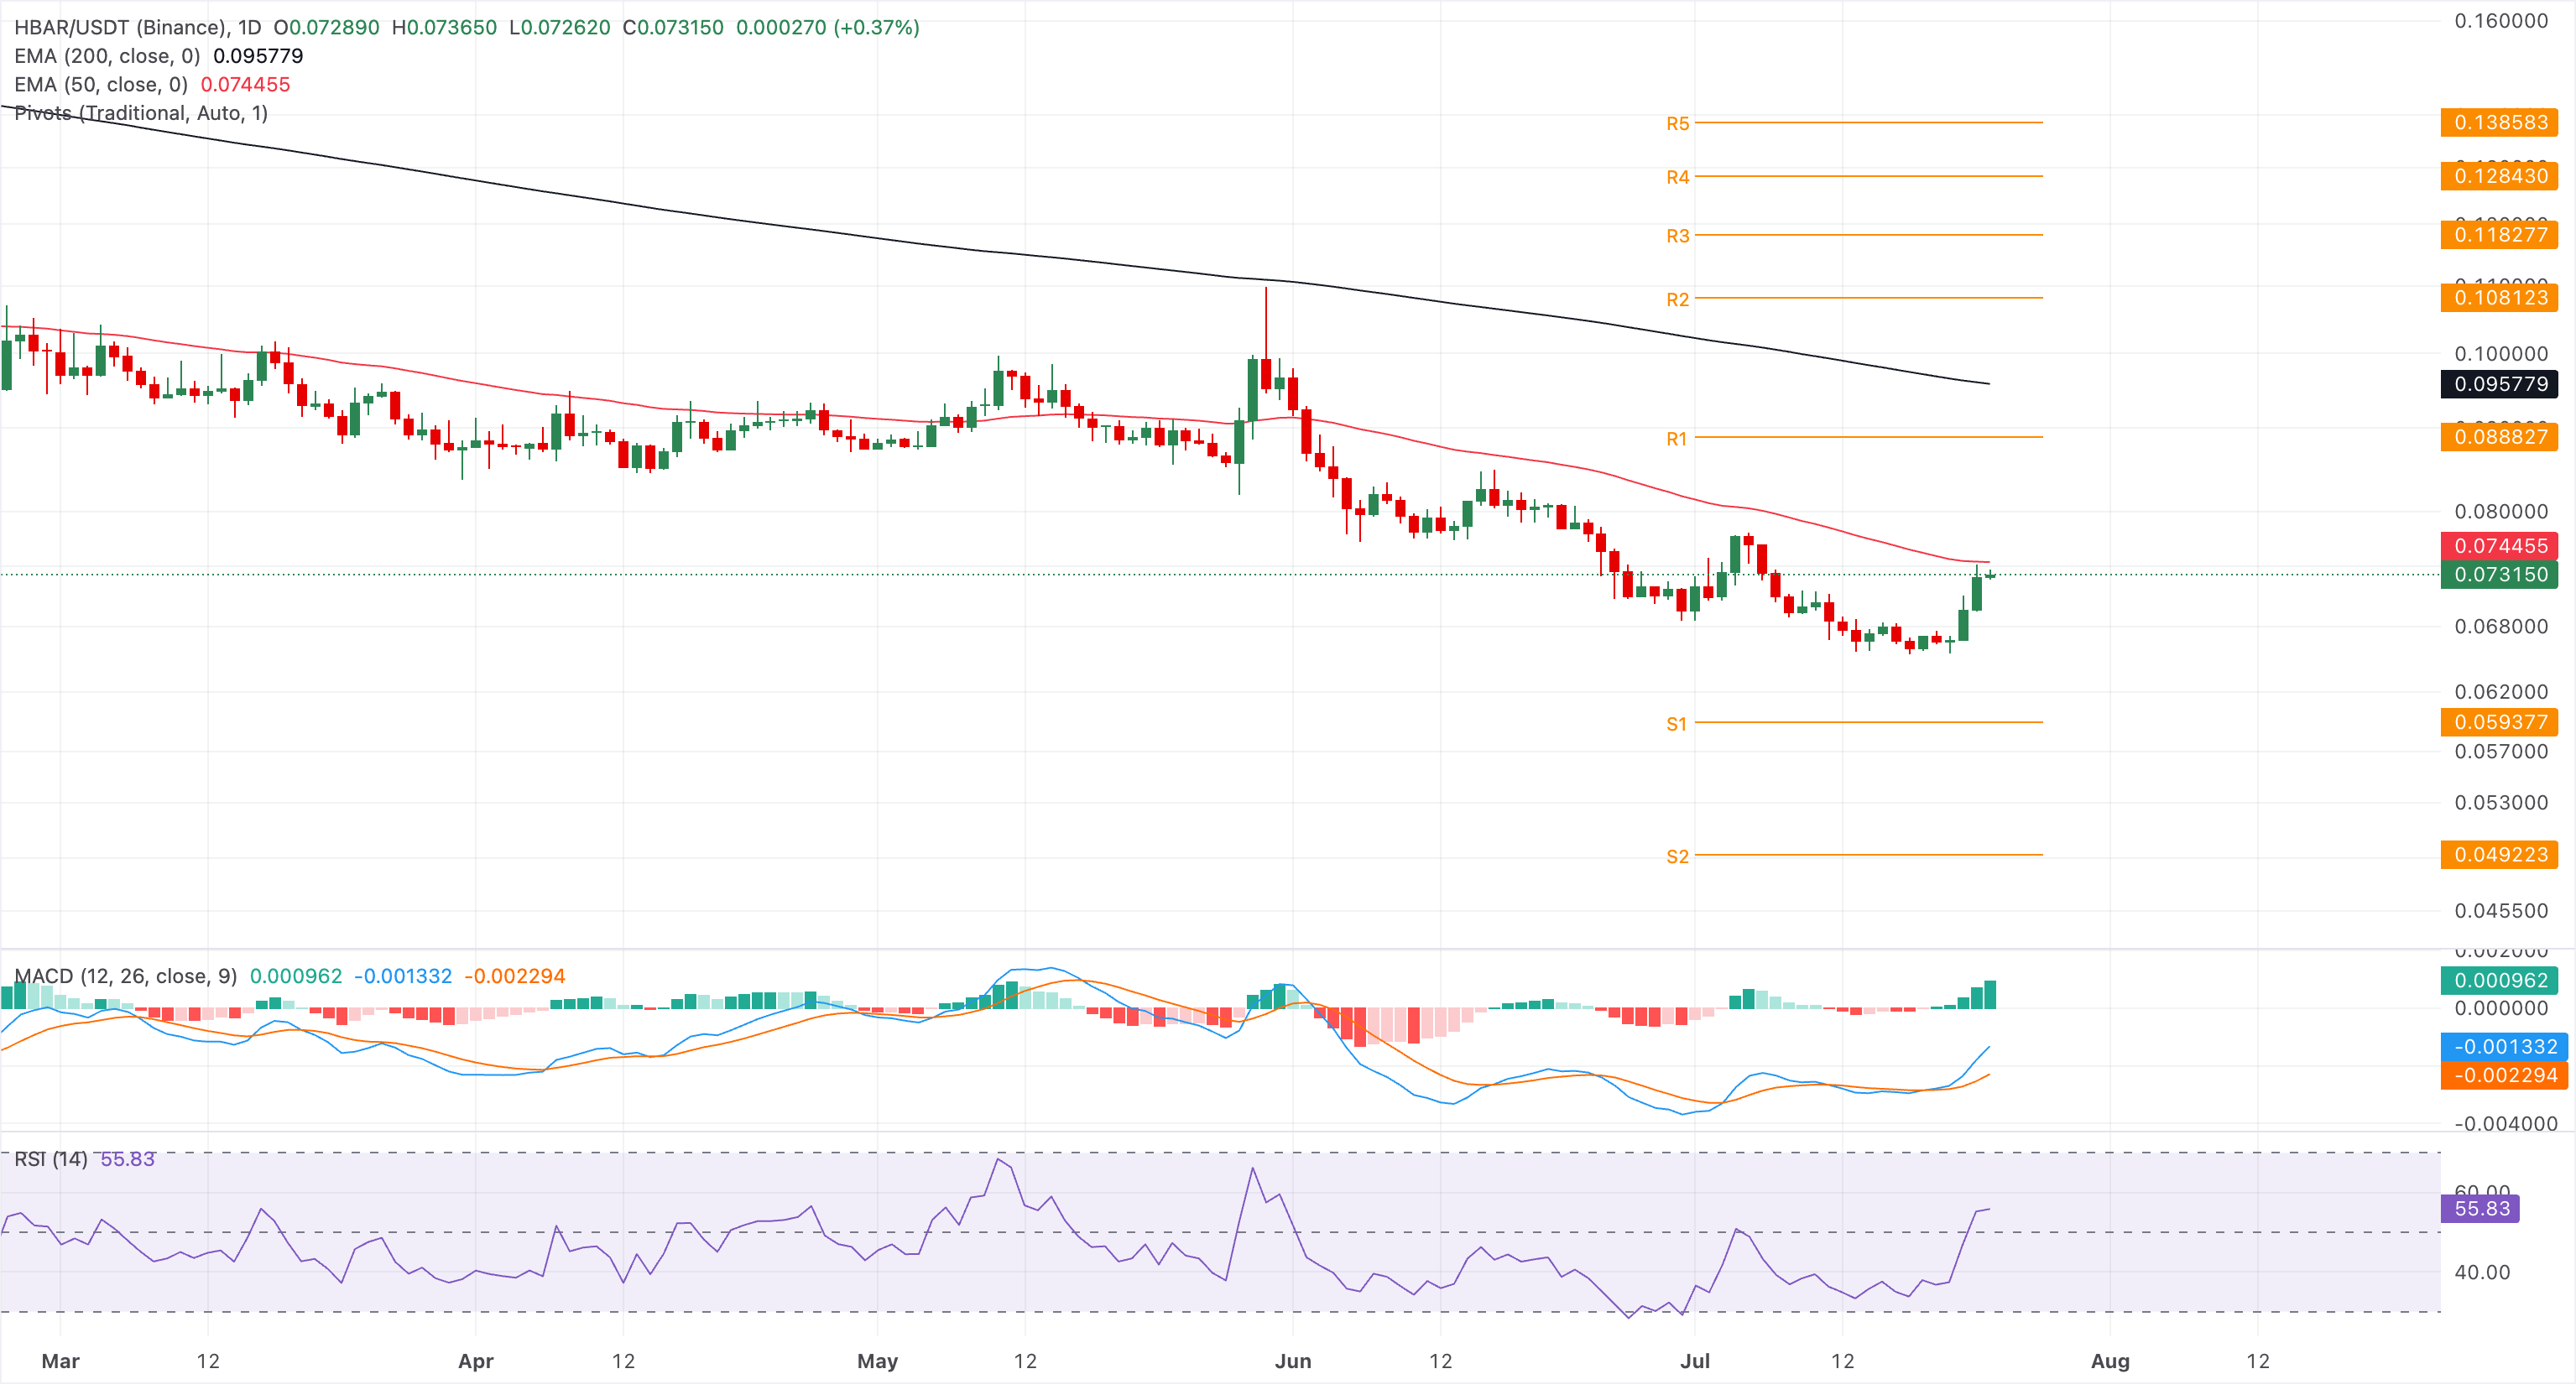
Looking down, the S1 Pivot level at $0.0593 emerges as the next crucial support level if price reverts from the 50-day EMA.
Lido DAO hovers below $0.4000 at press time on Thursday, extending a bullish recovery above the 50-day EMA at $0.3188. Price is now pressing into the lower edge of a broader resistance area, with the 200-day EMA at $0.4095 capping the advance ahead of the 78.6% retracement from $0.4700 to $0.2341 at $0.4195.
A sustained breakout above the 200-day EMA at $0.4095 could extend the rally toward the previous swing high at $0.4700, followed by the $0.5000 psychological threshold.
The RSI is near 75, in overbought territory, and a positive MACD and signal line suggest strong upside momentum that is increasingly stretched.
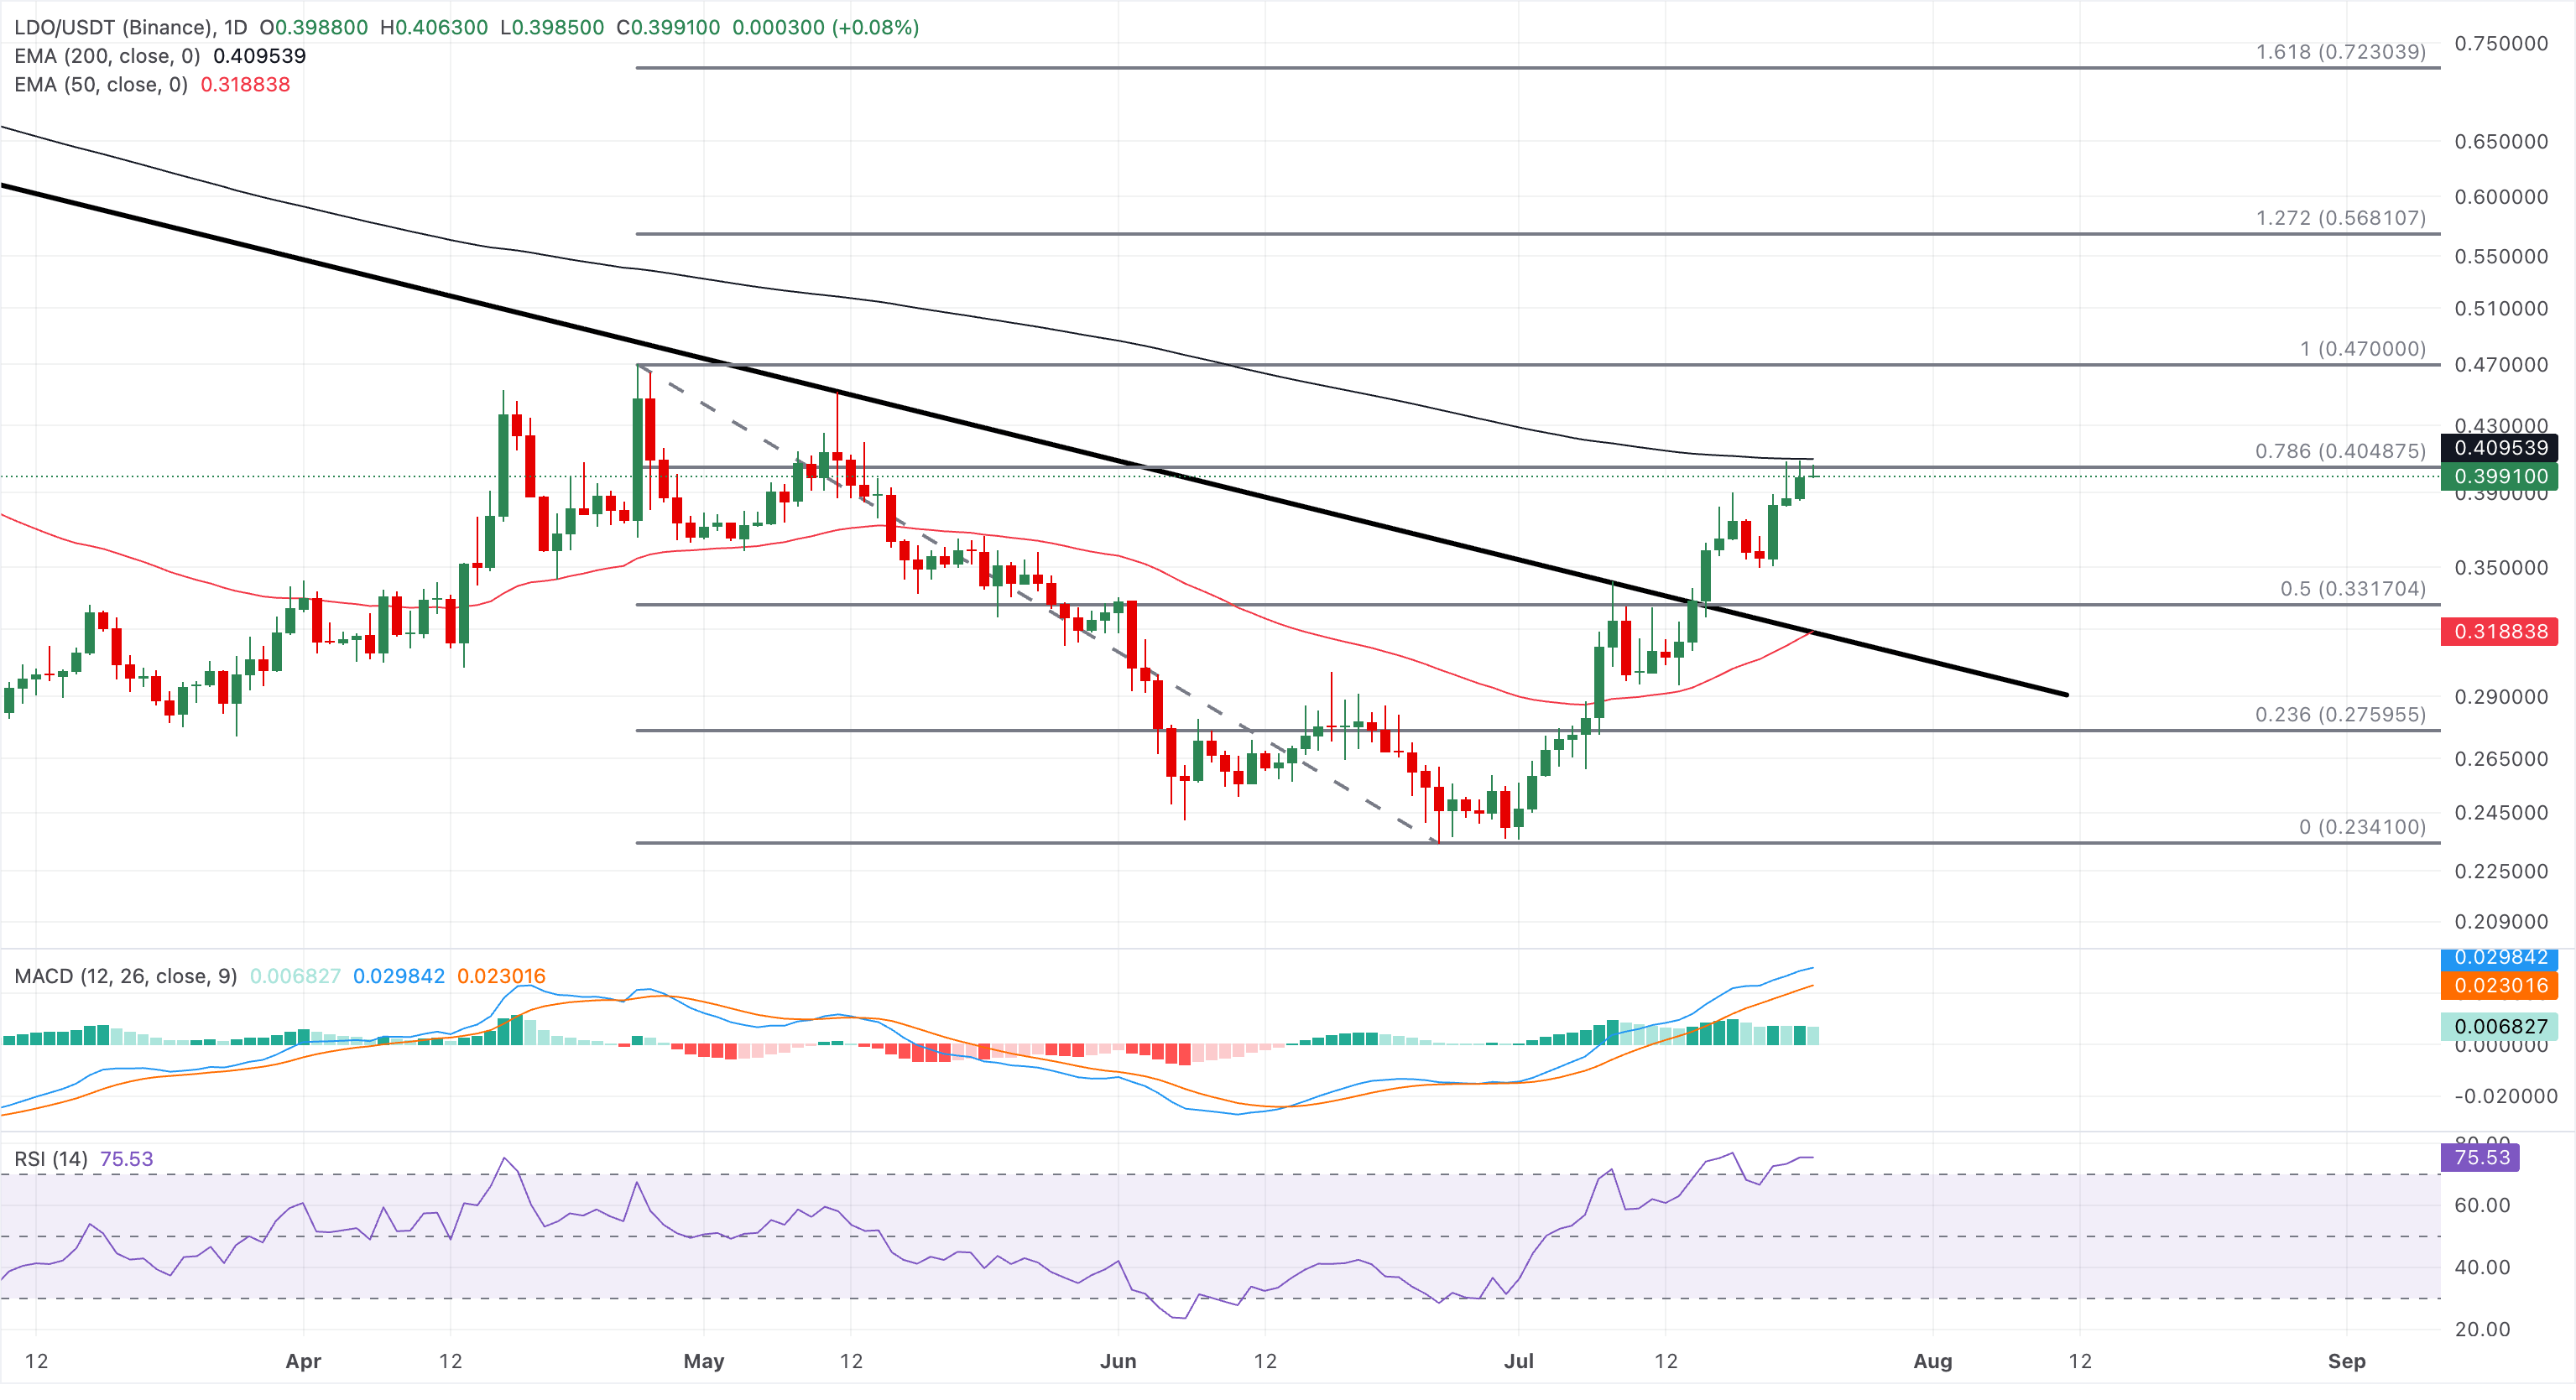
On the downside, immediate support is located at the prior breakout zone around the 50% Fibonacci retracement at $0.3317, followed by the 50-day EMA at $0.3188.
(The technical analysis of this story was written with the help of an AI tool. Know more.)
Recommended Articles









Comments (0)
Click the $ button, enter the symbol, and select to link a stock, ETF, or other ticker.