


Hyperliquid Price Forecast: HYPE gears up for a higher leg as bullish momentum resurfaces



- Hyperliquid steadies above $66 on Friday, following a 7% rebound above its 50-day EMA around $60.
- The retail demand for HYPE has held steady, while ETF inflows remain below $3 million so far this week.
- The technical outlook for HYPE is bullish, with momentum resurfacing after a brief cooling period.
Hyperliquid (HYPE) extends gains above $66 on Friday, maintaining a long-term upward trend supported by its rising 50-day Exponential Moving Average (EMA) around $60. Retail demand for HYPE rises in the near term, with Open Interest up around 5% over 24 hours as funding rates hold above zero, while institutional demand remains muted so far this week.
Retail demand builds despite institutional silence
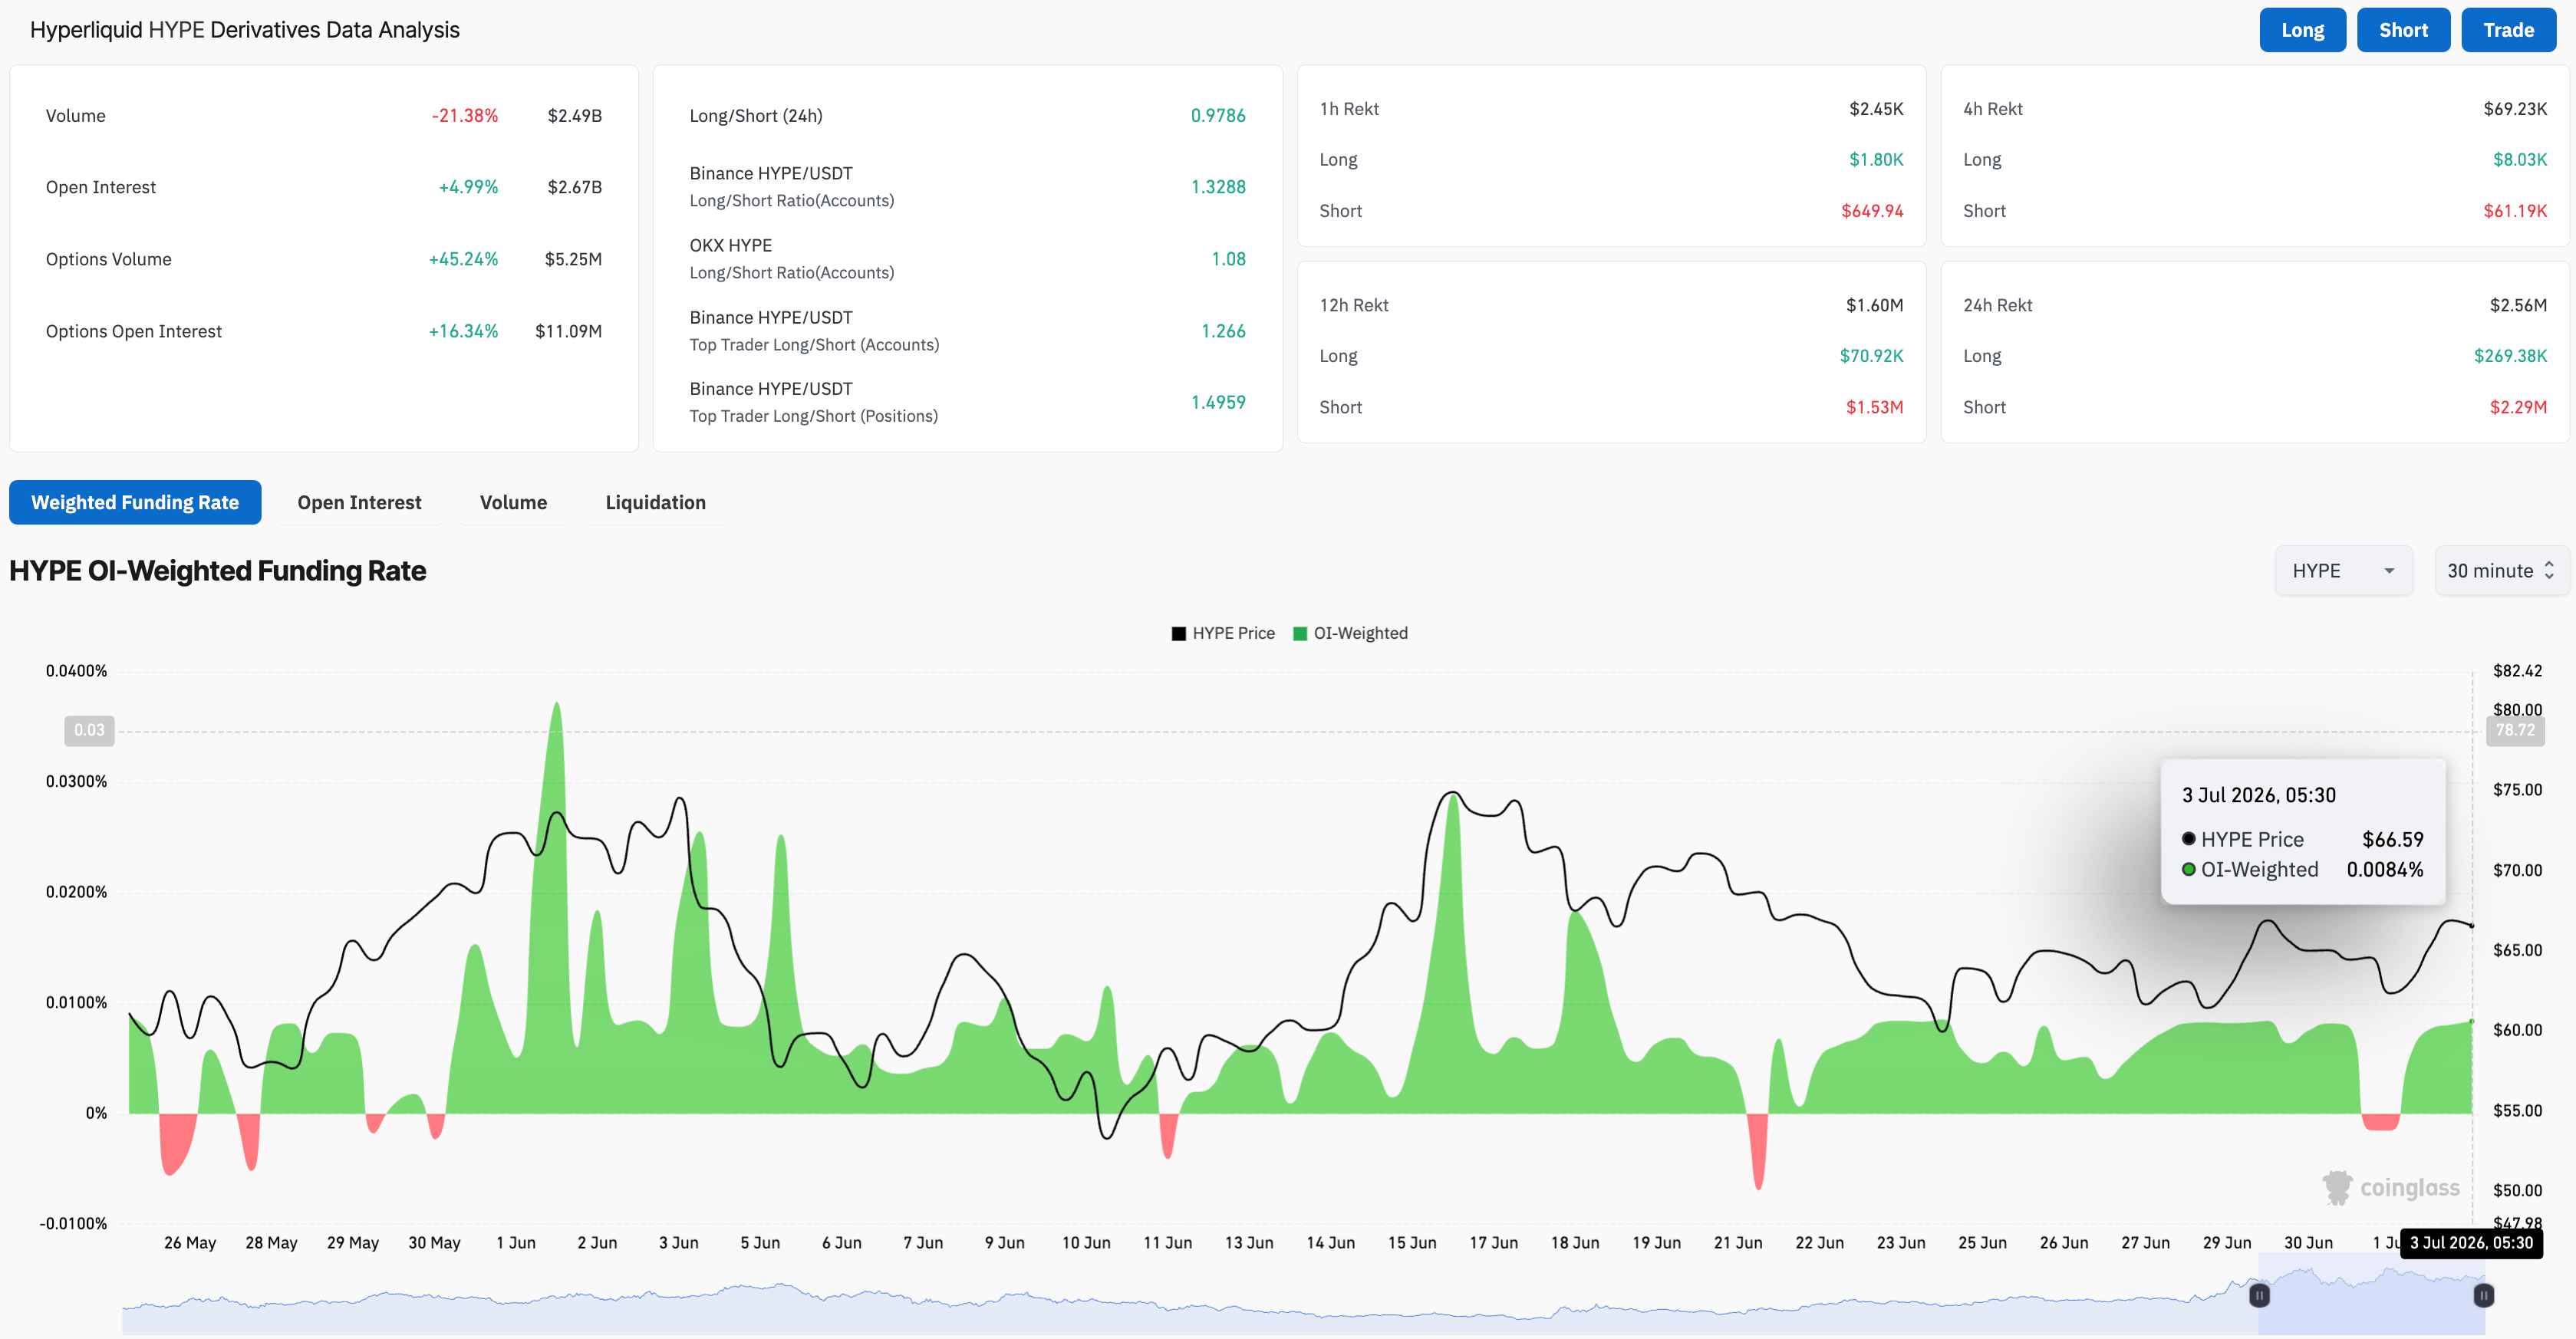
Hyperliquid gains retail strength as Bitcoin’s recovery above $61,000 on Friday eases broader market risk-off. CoinGlass data shows the HYPE futures Open Interest (OI) is up 5% over the last 24 hours, reaching $2.67 billion. This indicates a positional buildup in HYPE futures, which typically indicates a risk-on sentiment. In addition, the funding rates plateau around 0.0084%, reaffirming a largely bullish positional buildup as traders are willing to buy long positions at a premium.
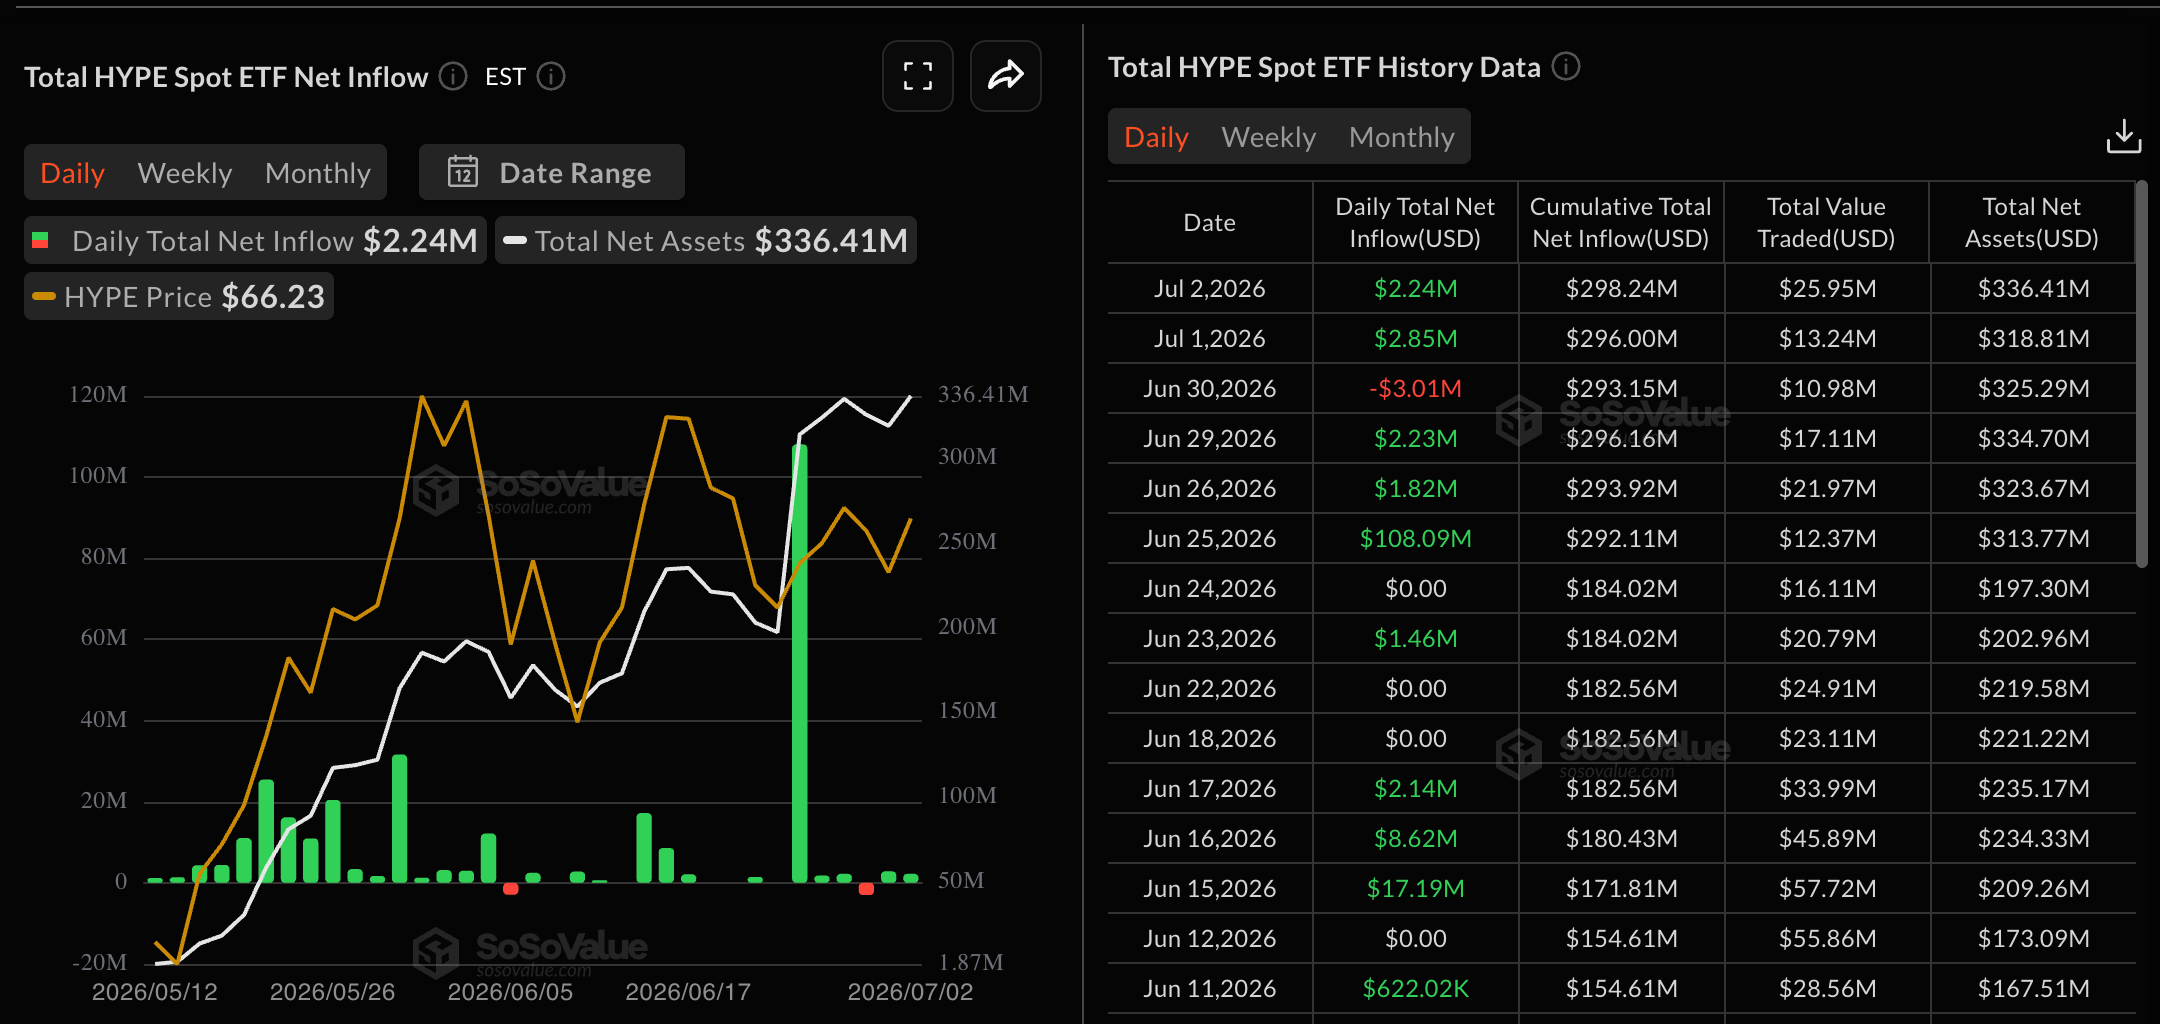
However, the institutional demand remains low. Data shows HYPE-focused Exchange Traded Funds (ETFs) recorded $2.24 million on Thursday, after a $2.85 million inflow the previous day. The mild inflows of less than $3 million so far this week, in addition to the $3 million outflow on Tuesday, following the $108 million inflow on June 25, reflect passivity among institutional buyers.
HYPE gears up for the next bullish rally
Hyperliquid above $66 on Friday holds a constructive bullish bias as it stays comfortably above the 50-day EMA near $60.65 and the 200-day EMA around $46.57. This placement above both medium- and long-term trend gauges suggests the broader uptrend remains intact.
The Relative Strength Index (RSI) near 54 hints at balanced but positive momentum, while the Moving Average Convergence Divergence (MACD) is on the verge of crossing above its signal line, suggesting that recent downside pressure is losing traction.
On the topside, immediate resistance is seen at the 78.6% Fibonacci retracement around $66.22, measured over the upswing from $38.17 to $76.93. A break above $66.22 could expose the prior swing region near $76.94, followed by the 127.2% Fibonacci extension at $93.08.
On the downside, first support emerges at the the 50-day EMA at $60.65, followed by the 50% retracement at $54.19.
(The technical analysis of this story was written with the help of an AI tool.)
Recommended Articles









Comments (0)
Click the $ button, enter the symbol, and select to link a stock, ETF, or other ticker.