


Ripple and Stellar outlook: XRP and XLM build on recovery as traders turn cautiously bullish



- XRP extends its rebound, trading above $1.05 on Thursday as buyers build on the recent recovery.
- XLM climbs above $0.199, marking a fourth consecutive day of gains of over 15% so far this week.
- Mixed on-chain and derivatives data point to cautious optimism among traders.
Ripple (XRP) and Stellar (XLM) extend recovery on Thursday as improving market sentiment supports a rebound. XRP trades above $1.05 while XLM climbs past $0.199. Traders should remain cautious, as mixed on-chain and derivatives data indicate a modest bullish bias, and further upside may depend on sustained buying momentum.
Improving derivatives metrics
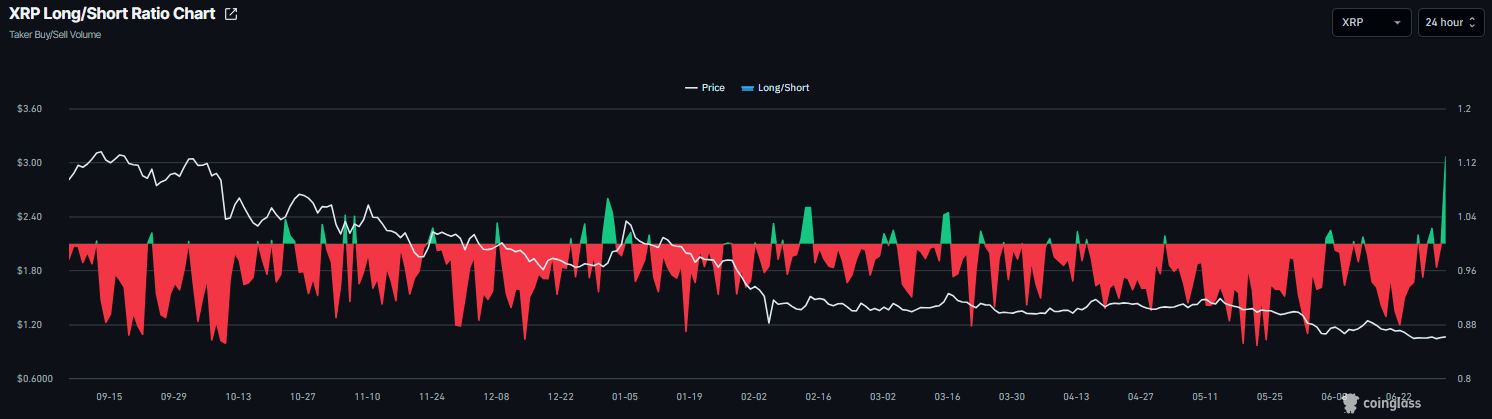
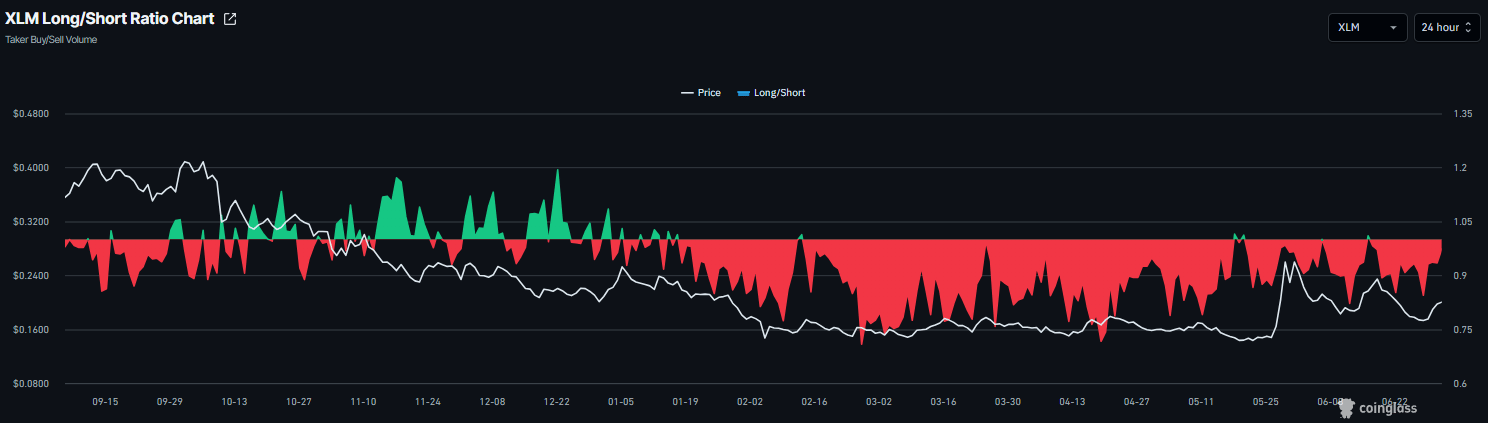
Derivatives data shows a mixed outlook with a slightly bullish tilt. CoinGlass’ long-to-short ratio for XRP reads 1.12 on Thursday, the highest level in over a month, indicating a positive bias. During the same period, XLM's long-to-short ratio stands at 0.97, remaining marginally below the neutral zone but edging closer to bullish territory, suggesting bearish sentiment is gradually easing.
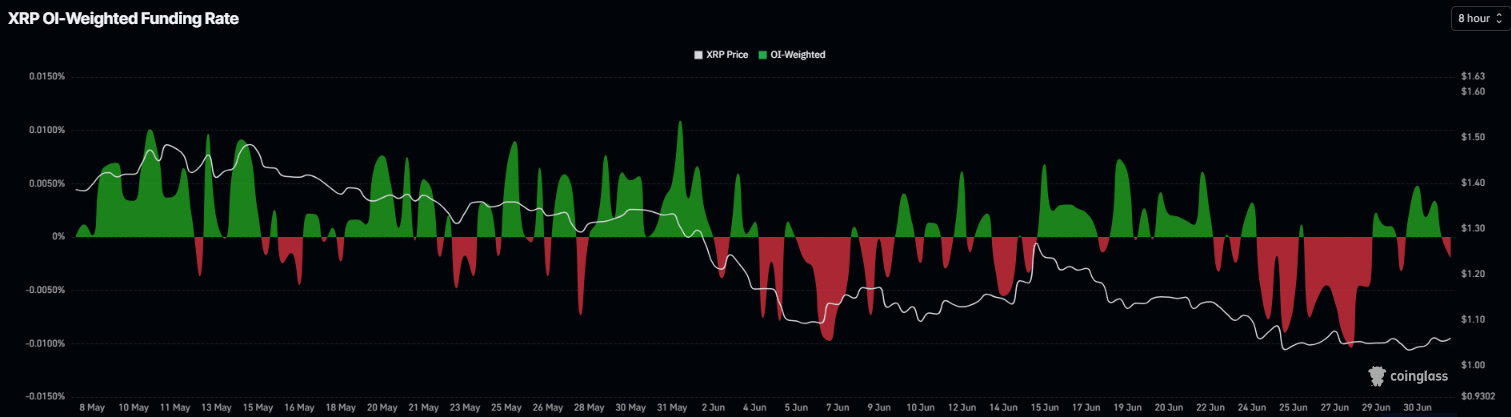
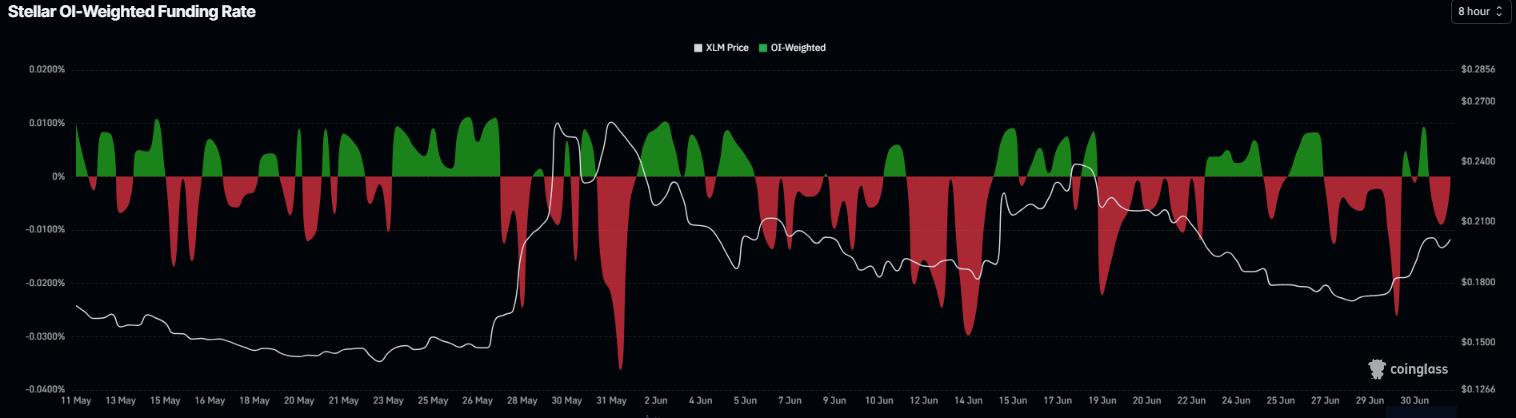
However, XRP and XLM funding rates remain slightly negative at -0.002% and -0.0015%, respectively, on Thursday, indicating bearish sentiment still lingers despite improving price action.
Mixed on-chain outlook
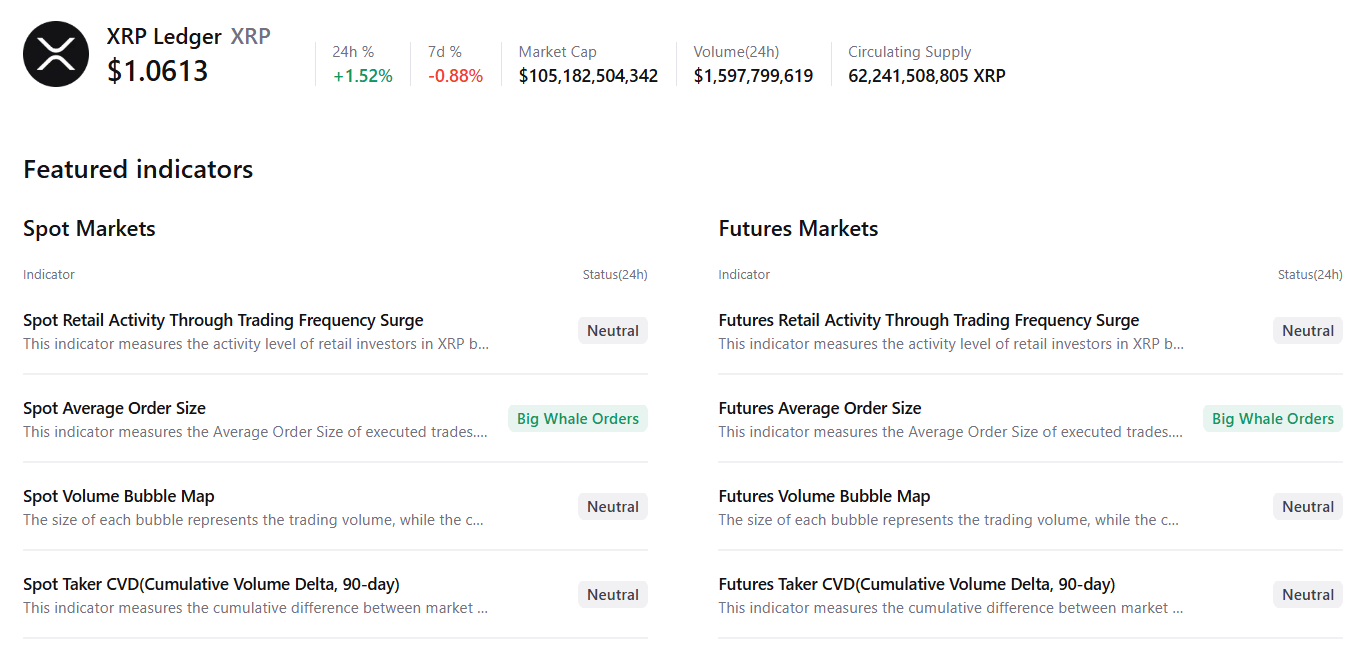
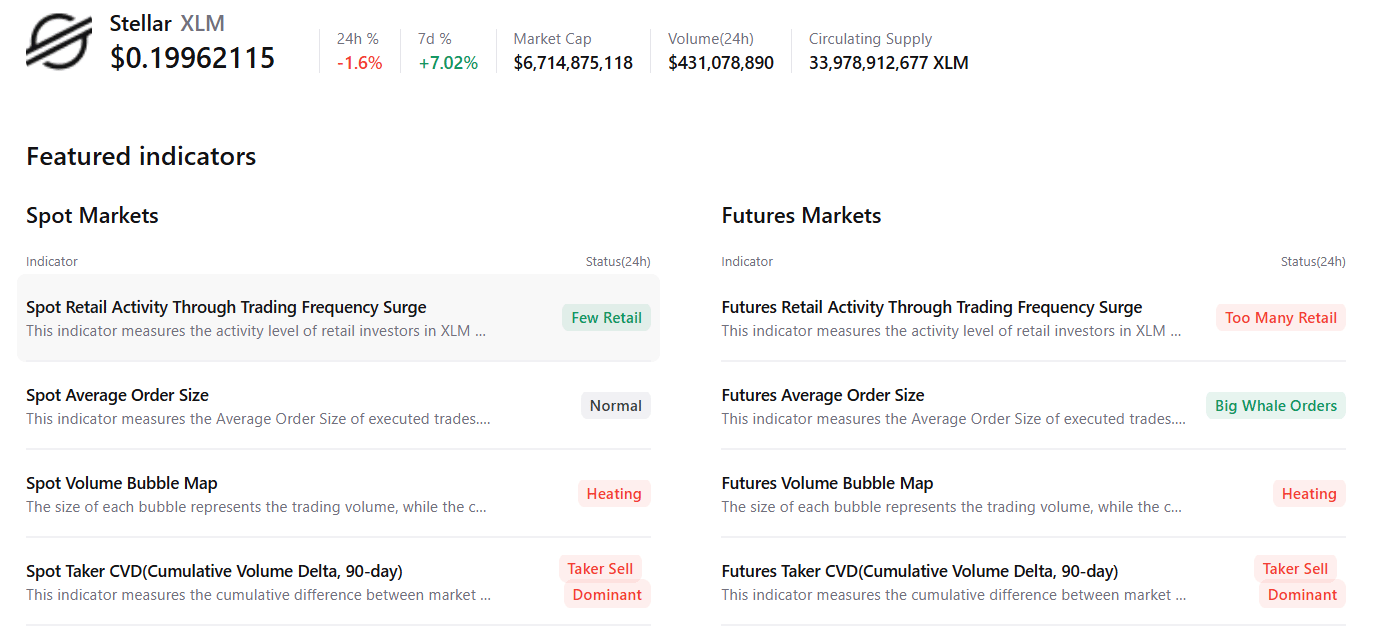
CryptoQuant’s summary data shows mixed sentiment. XRP’s spot and futures markets show large whales' orders with neutral conditions in other metrics, supporting a potential recovery. However, XLM shows overheating and selling-side dominance in both markets, with mixed retail activity, hinting at cautious sentiment among traders and capping any potential recovery.
XRP technical outlook: Key $1 support holds strong
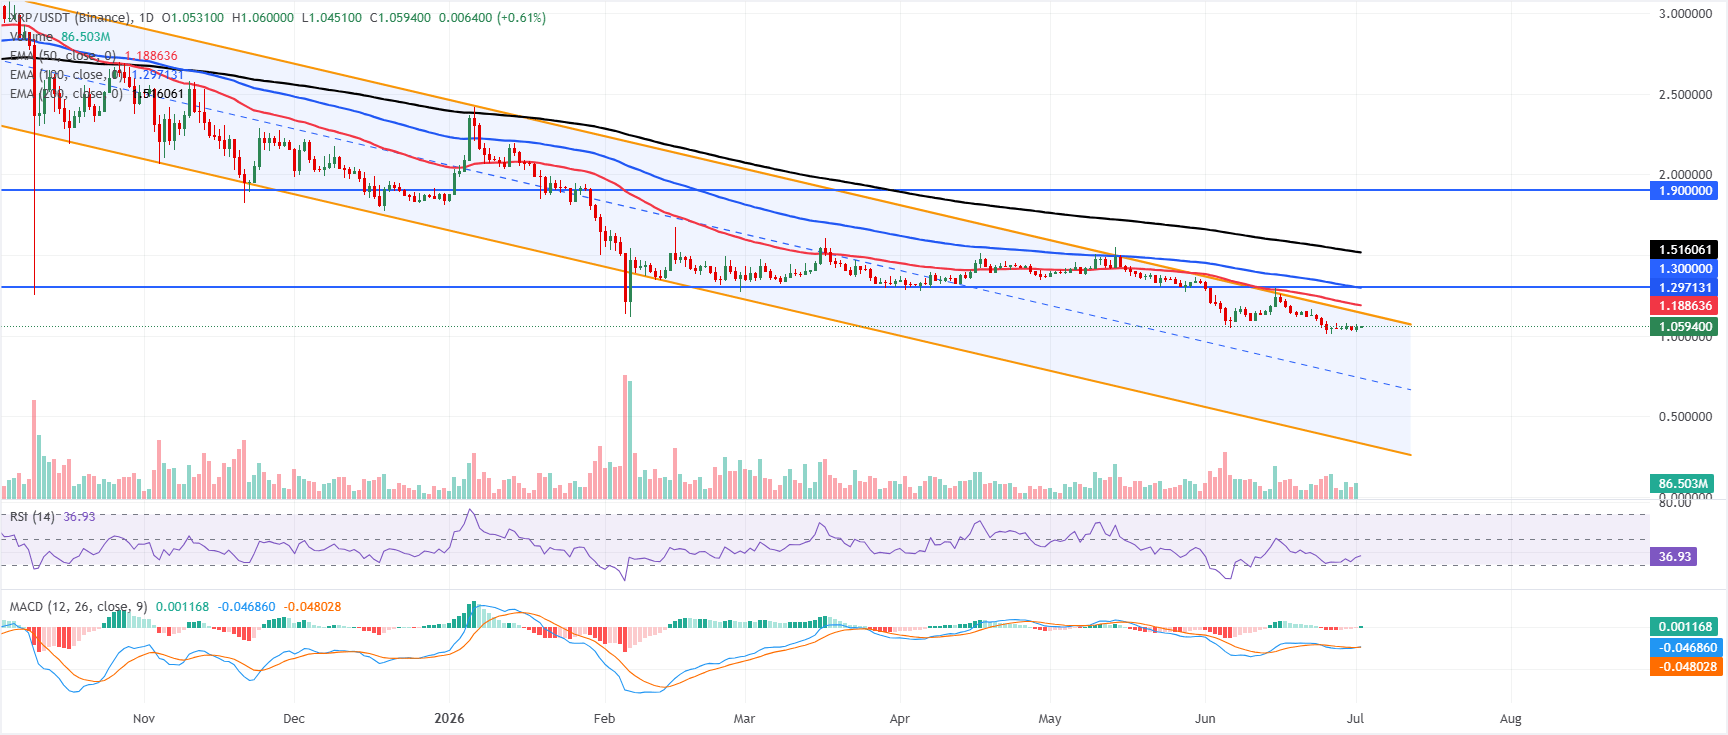
XRP price trades at $1.059 on Thursday, extending recovery after holding above the key psychological level of $1.00. Despite this recovery, XRP maintains a bearish long-term bias, as it remains well below the 50-day, 100-day, and 200-day Exponential Moving Averages (EMAs) at $1.188, $1.297, and $1.516, respectively. Price also sits beneath the upper boundary of the downward parallel channel near $1.141, keeping the pair confined within a broader corrective structure.
The Relative Strength Index (RSI) at 36 remains weak but off oversold territory. At the same time, the Moving Average Convergence Divergence (MACD) has turned marginally positive, hinting at fading downside momentum rather than a decisive bullish turnaround.
On the topside, initial resistance is located at the channel boundary around $1.141, followed by the 50-day EMA at $1.188, where sellers could re-emerge on any bounce. Above, the 100-day EMA at $1.297 aligns with the horizontal barrier at $1.3000, forming a dense cap.
With no clear support levels apart from the key psychological level at $1.00, XRP remains vulnerable to further downside below this level until new demand zones emerge on the chart or momentum improves more convincingly.
XLM technical outlook: Price action shows bullish bias
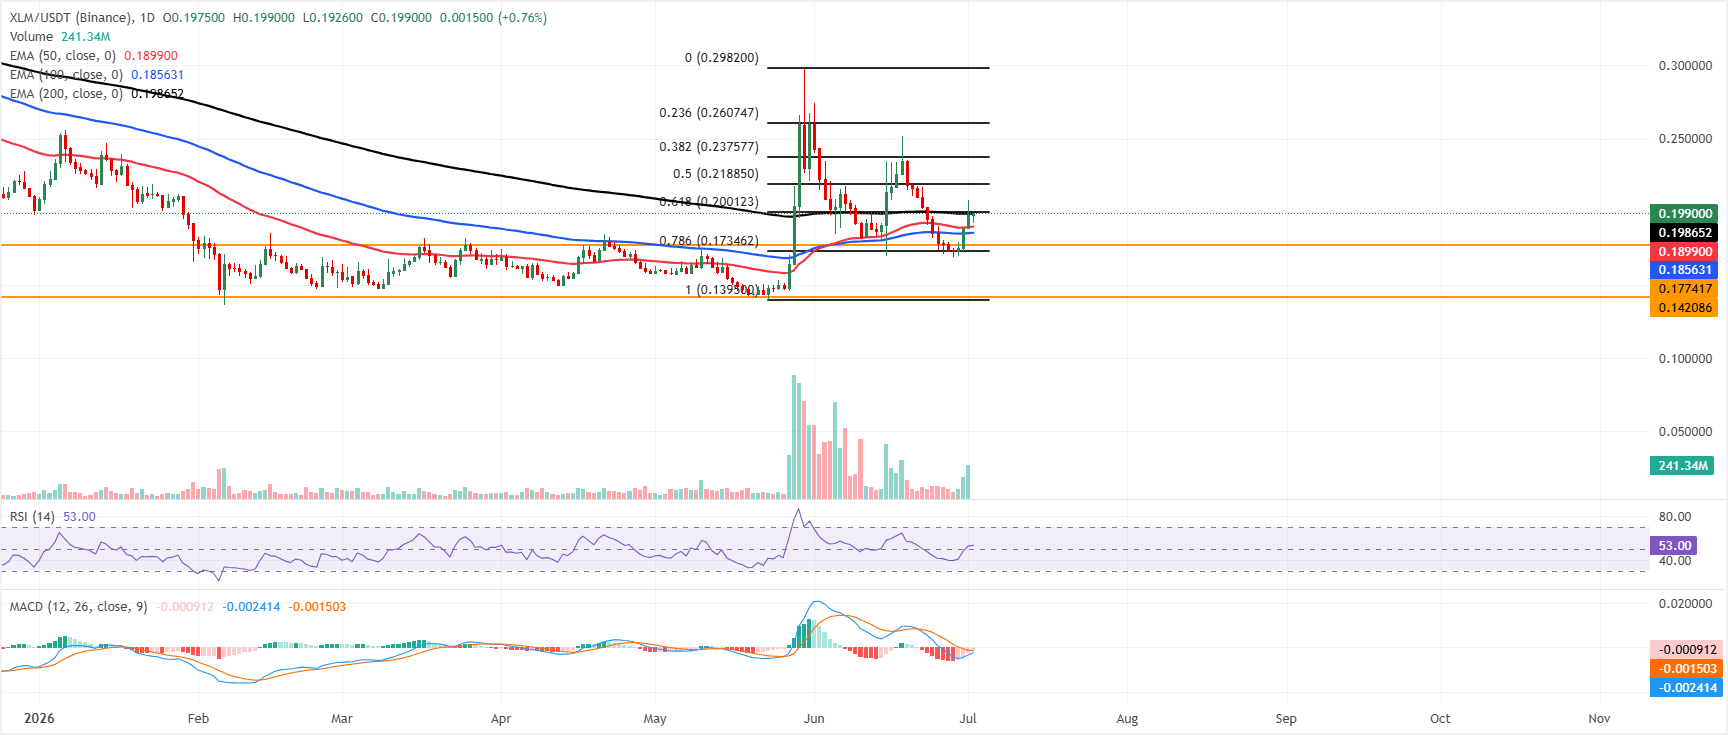
Stellar price trades at $0.199, holding a constructive near-term bias as price sits above the 50-, 100-day and 200-day EMAs, clustered between roughly $0.186 and $0.199. This EMA stack now underpins the rebound from the late-May lows. At the same time, the RSI at about 53 is modestly positive and the MACD, still marginally below zero but contracting, hints that bearish momentum is fading.
On the topside, initial resistance is located at the 61.8% Fibonacci retracement of the latest swing near $0.200, with further hurdles at the 50% retracement around $0.218, followed by $0.237 and $0.260, corresponding to the 38.2% and 23.6% Fibonacci retracement levels respectively.
On the downside, immediate support is provided by the 200-day EMA near $0.198, ahead of the 50-day and 100-day EMAs at $0.189 and $0.185; a deeper pullback would expose horizontal support at $0.177, reinforced by the 78.6% Fibonacci level at $0.173, while $0.142 marks a more distant structural floor.
(The technical analysis of this story was written with the help of an AI tool.)
Recommended Articles









Comments (0)
Click the $ button, enter the symbol, and select to link a stock, ETF, or other ticker.