


Pi Network Price Forecast: PI hits record low as risk appetite weakens



- Pi Network extends losses on Tuesday for the third consecutive day after hitting a record low of $0.1120 the previous day.
- Data shows a declining trend in PI token Open Interest as investors' risk appetite wanes.
- The technical outlook for PI remains bearish, with a risk of a steeper downside spiral.
Pi Network (PI) remains under intense selling pressure on Tuesday, extending losses after hitting a record low of $0.1120 the previous day. The Pi2Day celebrations on Sunday failed to lift retail demand as the Open Interest continues to decline, indicating reduced risk appetite. PI should hold above $0.1120 to avoid a steeper correction that could threaten the $0.1000 psychological level.
Buyer conviction fades for PI
Investors are losing confidence in the PI token amid a broader market downturn. Heavy risk-off sentiment weighs on speculative altcoins like Pi Network, which often require a catalyst or community demand to fuel an upcycle.
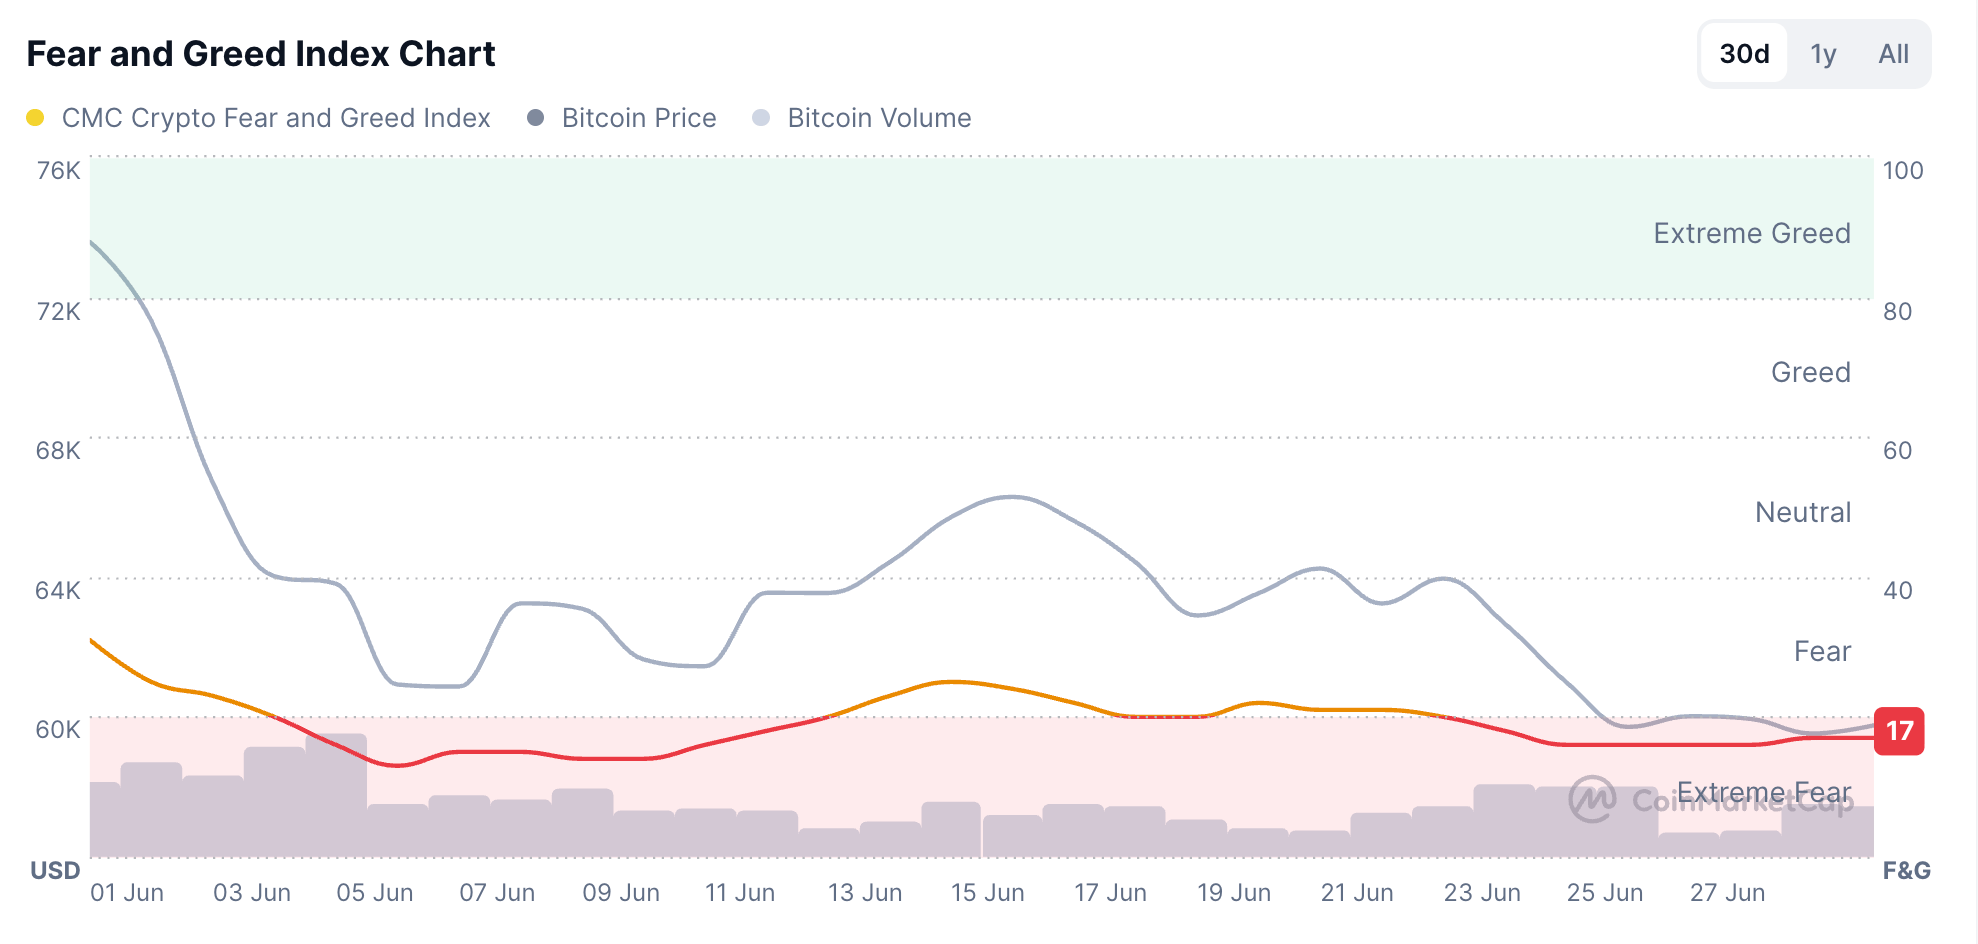
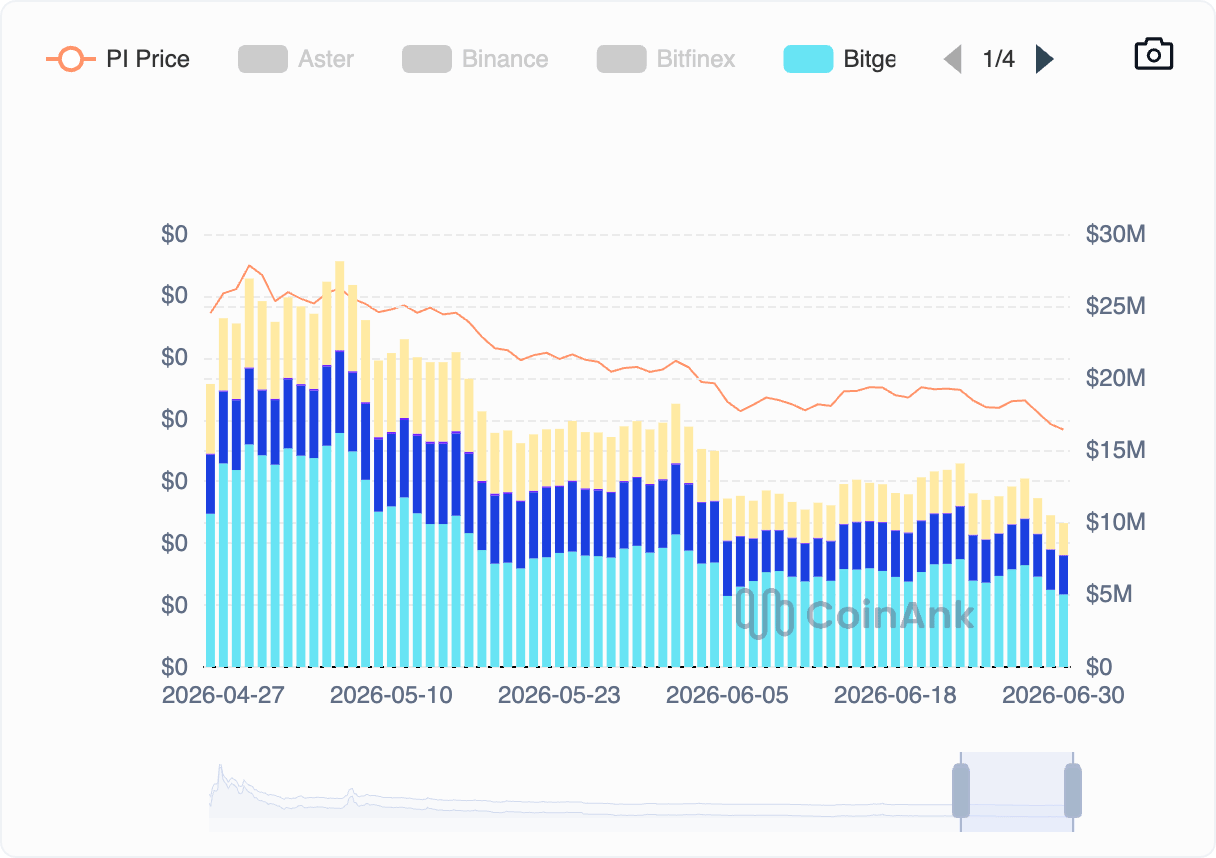
The Crypto Fear and Greed Index at 17 reflects steady risk-averse behavior among investors, while CoinAnk data shows a declining trend in PI Open Interest (OI), which crossed below $10 million on Tuesday. For a sustained recovery in PI, broader market risk-on sentiment and a community-linked catalyst, such as a listing on a top-tier exchange, emerge as the need of the hour.
Technical outlook: How low will PI token price go?
Pi Network is trading below $0.1200 at press time on Tuesday, extending losses for the third consecutive day. The steady three-day decline in PI reached a fresh record low of $0.1120 on Monday, breaking below the $0.1184 low set on June 6.
Momentum on the daily timeframe supports the bearish outlook. The Moving Average Convergence Divergence (MACD) has crossed below the signal line, starting a fresh negative histogram. Meanwhile, the Relative Strength Index (RSI) at 28 slips back into the oversold zone with a downtick, indicating persistent downside pressure.
From a technical perspective, the PI token remains in a clear bearish spiral and is testing the S2 Pivot Point at $0.1124. If PI slips below this level, it could extend its decline toward the $0.1000 psychological level, followed by the S3 Pivot Point at $0.0836.
(The technical analysis of this story was written with the help of an AI tool.)
Recommended Articles







Comments (0)
Click the $ button, enter the symbol, and select to link a stock, ETF, or other ticker.