


Pi Network Price Forecast: Ecosystem Directory Staking upgrade boosts recovery hopes



- Pi Network price nears the $0.137 resistance zone on Monday, a breakout suggests a bullish move.
- The updated Ecosystem Directory Staking feature enhances app discovery and encourages users and developers to stake Pi, expanding the token’s utility.
- The technical outlook suggests a bullish bias, with improving momentum indicators signaling potential upside.
Pi Network (PI) is nearing the key resistance zone at $0.137 at the time of wrting on Monday, with a breakout suggesting a bullish move. The network announced that its updated Ecosystem Directory Staking feature enhances app discovery and encourages users and developers to stake Pi, expanding the token’s utility and supporting ecosystem growth. On the technical side, improving momentum indicators signal a potential upside breakout if buyers clear key resistance.
Utility-focused update backs bullish case
Pi Network announced on Saturday that it has updated the design for its Ecosystem Directory Staking feature, introducing user interface improvements that make it easier for users to discover and navigate applications within the Pi Browser.
“This feature provides a self-service avenue for developers and creators to use Pi to tap into the attention resource of Pi Network to acquire users”, said PI on its X post.
This update aims to encourage developers and users to stake Pi tokens to boost app visibility, increase the token’s utility and support broader ecosystem adoption.
Pi Network Price Forecast: PI could extend gains if it closes above the $0.137 mark
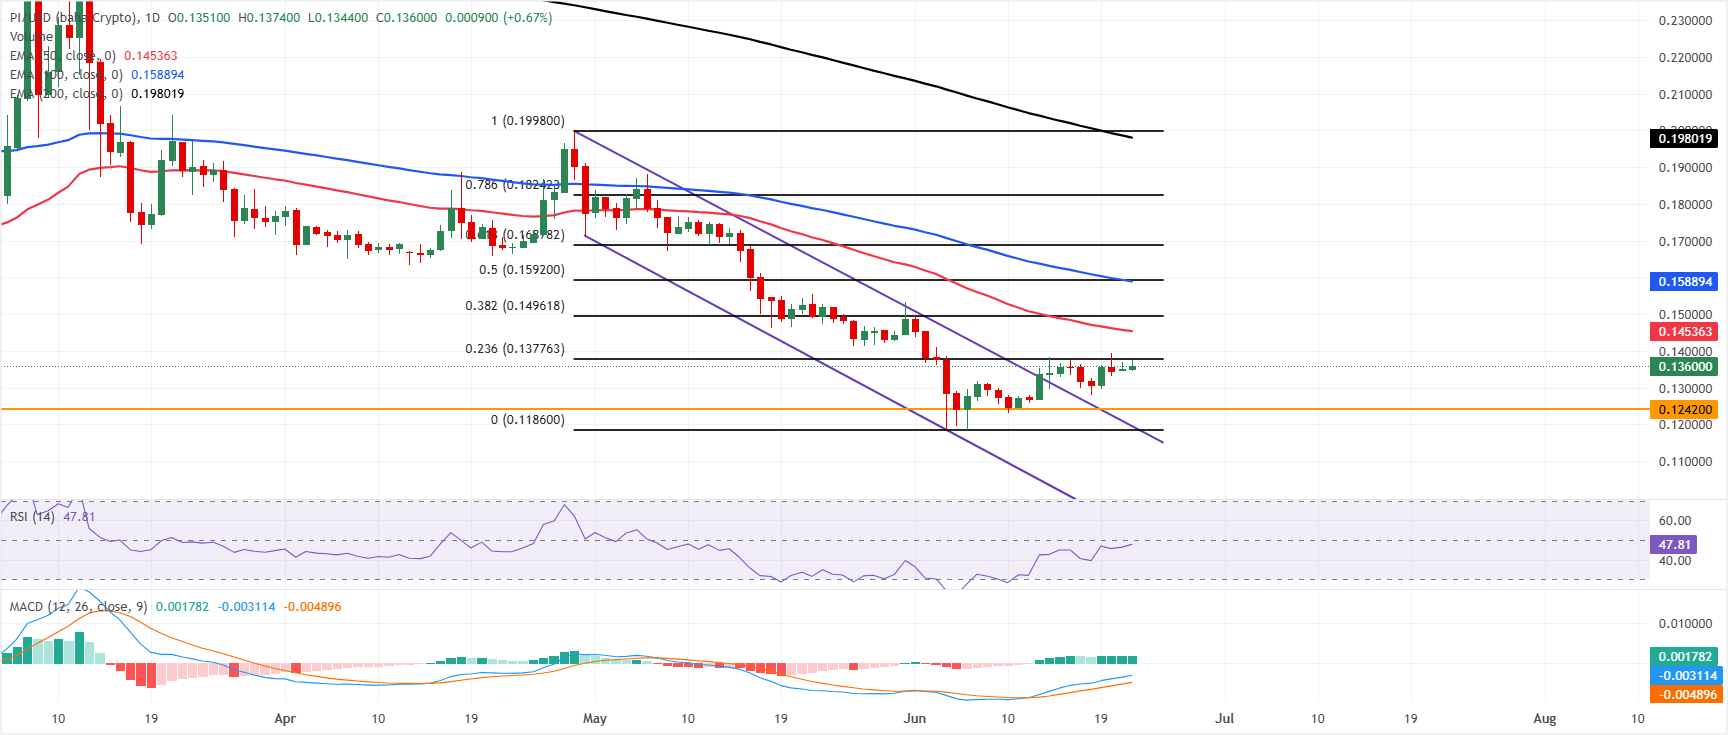
Pi Network trades at $0.135 on Monday after a mild recovery in the previous week. PI breaks and closes above the descending trendline resistance, supporting a near-term constructive bias. However, the recovery could be capped, as it remains well below the 50-day, 100-day, and 200-day Exponential Moving Averages (EMAs), clustered between roughly $0.145 and $0.1980.
The Relative Strength Index (RSI) at 47 sits just under the neutral line, hinting at only modest downside pressure, while the positive Moving Average Convergence Divergence (MACD) above zero suggests any rebounds are more likely corrective within a broader downtrend as long as these overhead EMAs remain intact.
On the topside, initial resistance is aligned at the 23.6% Fibonacci retracement at $0.137, with the 50-period EMA at $0.145. The 38.2% retracement near $0.149 forms a nearby cluster that could limit recovery attempts before the mid-range Fibo band and 100-period EMA around $0.159 – $0.159, and higher up, the 61.8% Fibonacci retracement at $0.168.
On the downside, immediate support emerges at the horizontal floor around $0.124, ahead of the Fibonacci anchor near $0.118, where a break would expose further weakness and extend the prevailing bearish structure.
(The technical analysis of this story was written with the help of an AI tool.)
Recommended Articles









Comments (0)
Click the $ button, enter the symbol, and select to link a stock, ETF, or other ticker.