


Sui Price Forecast: SUI risks a deeper bearish leg despite on-chain resilience



- Sui is down 2% on Friday, extending its decline toward the recent support leg formed at $0.6618.
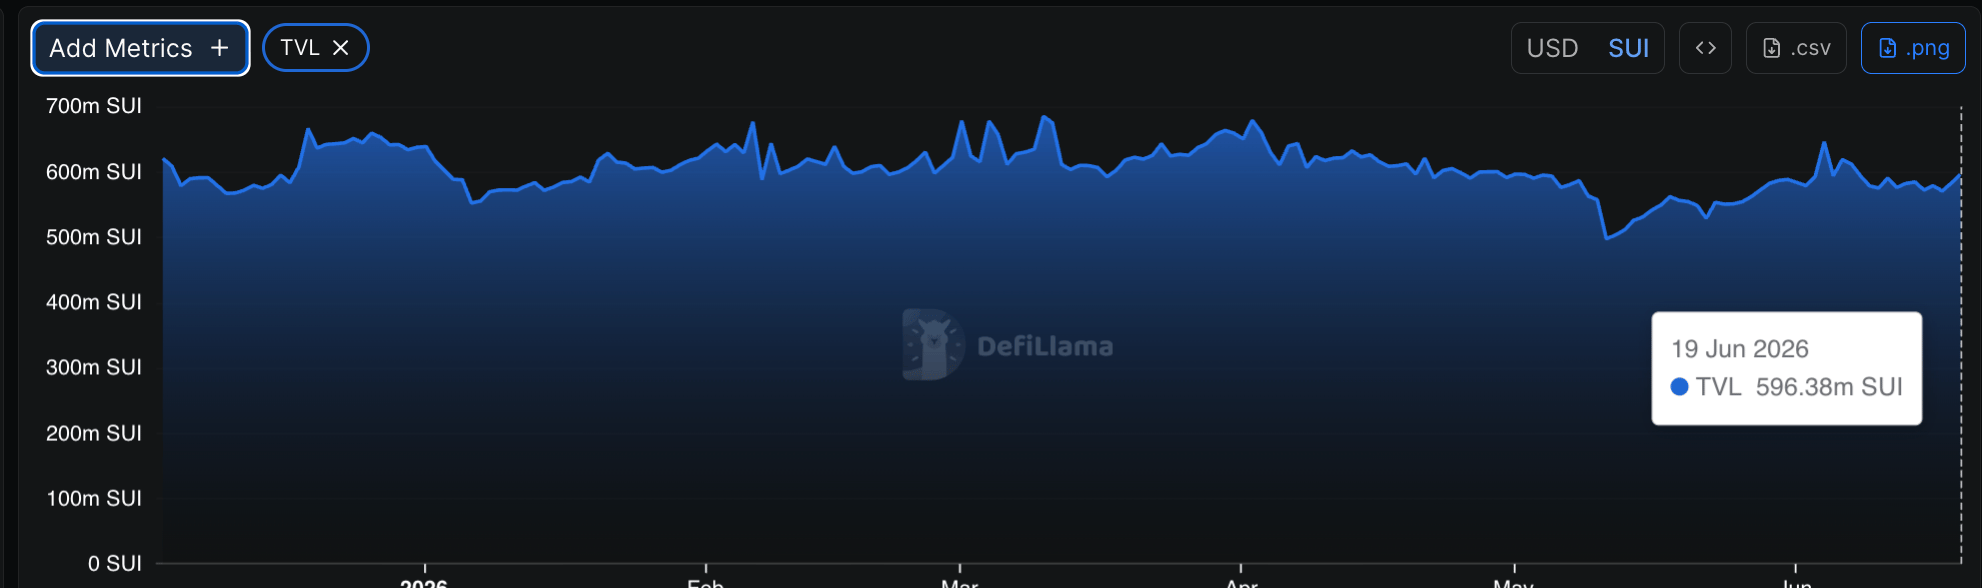
- The Total Value Locked in the Sui ecosystem has stabilized around 600 million SUI tokens, reflecting resilient user demand.
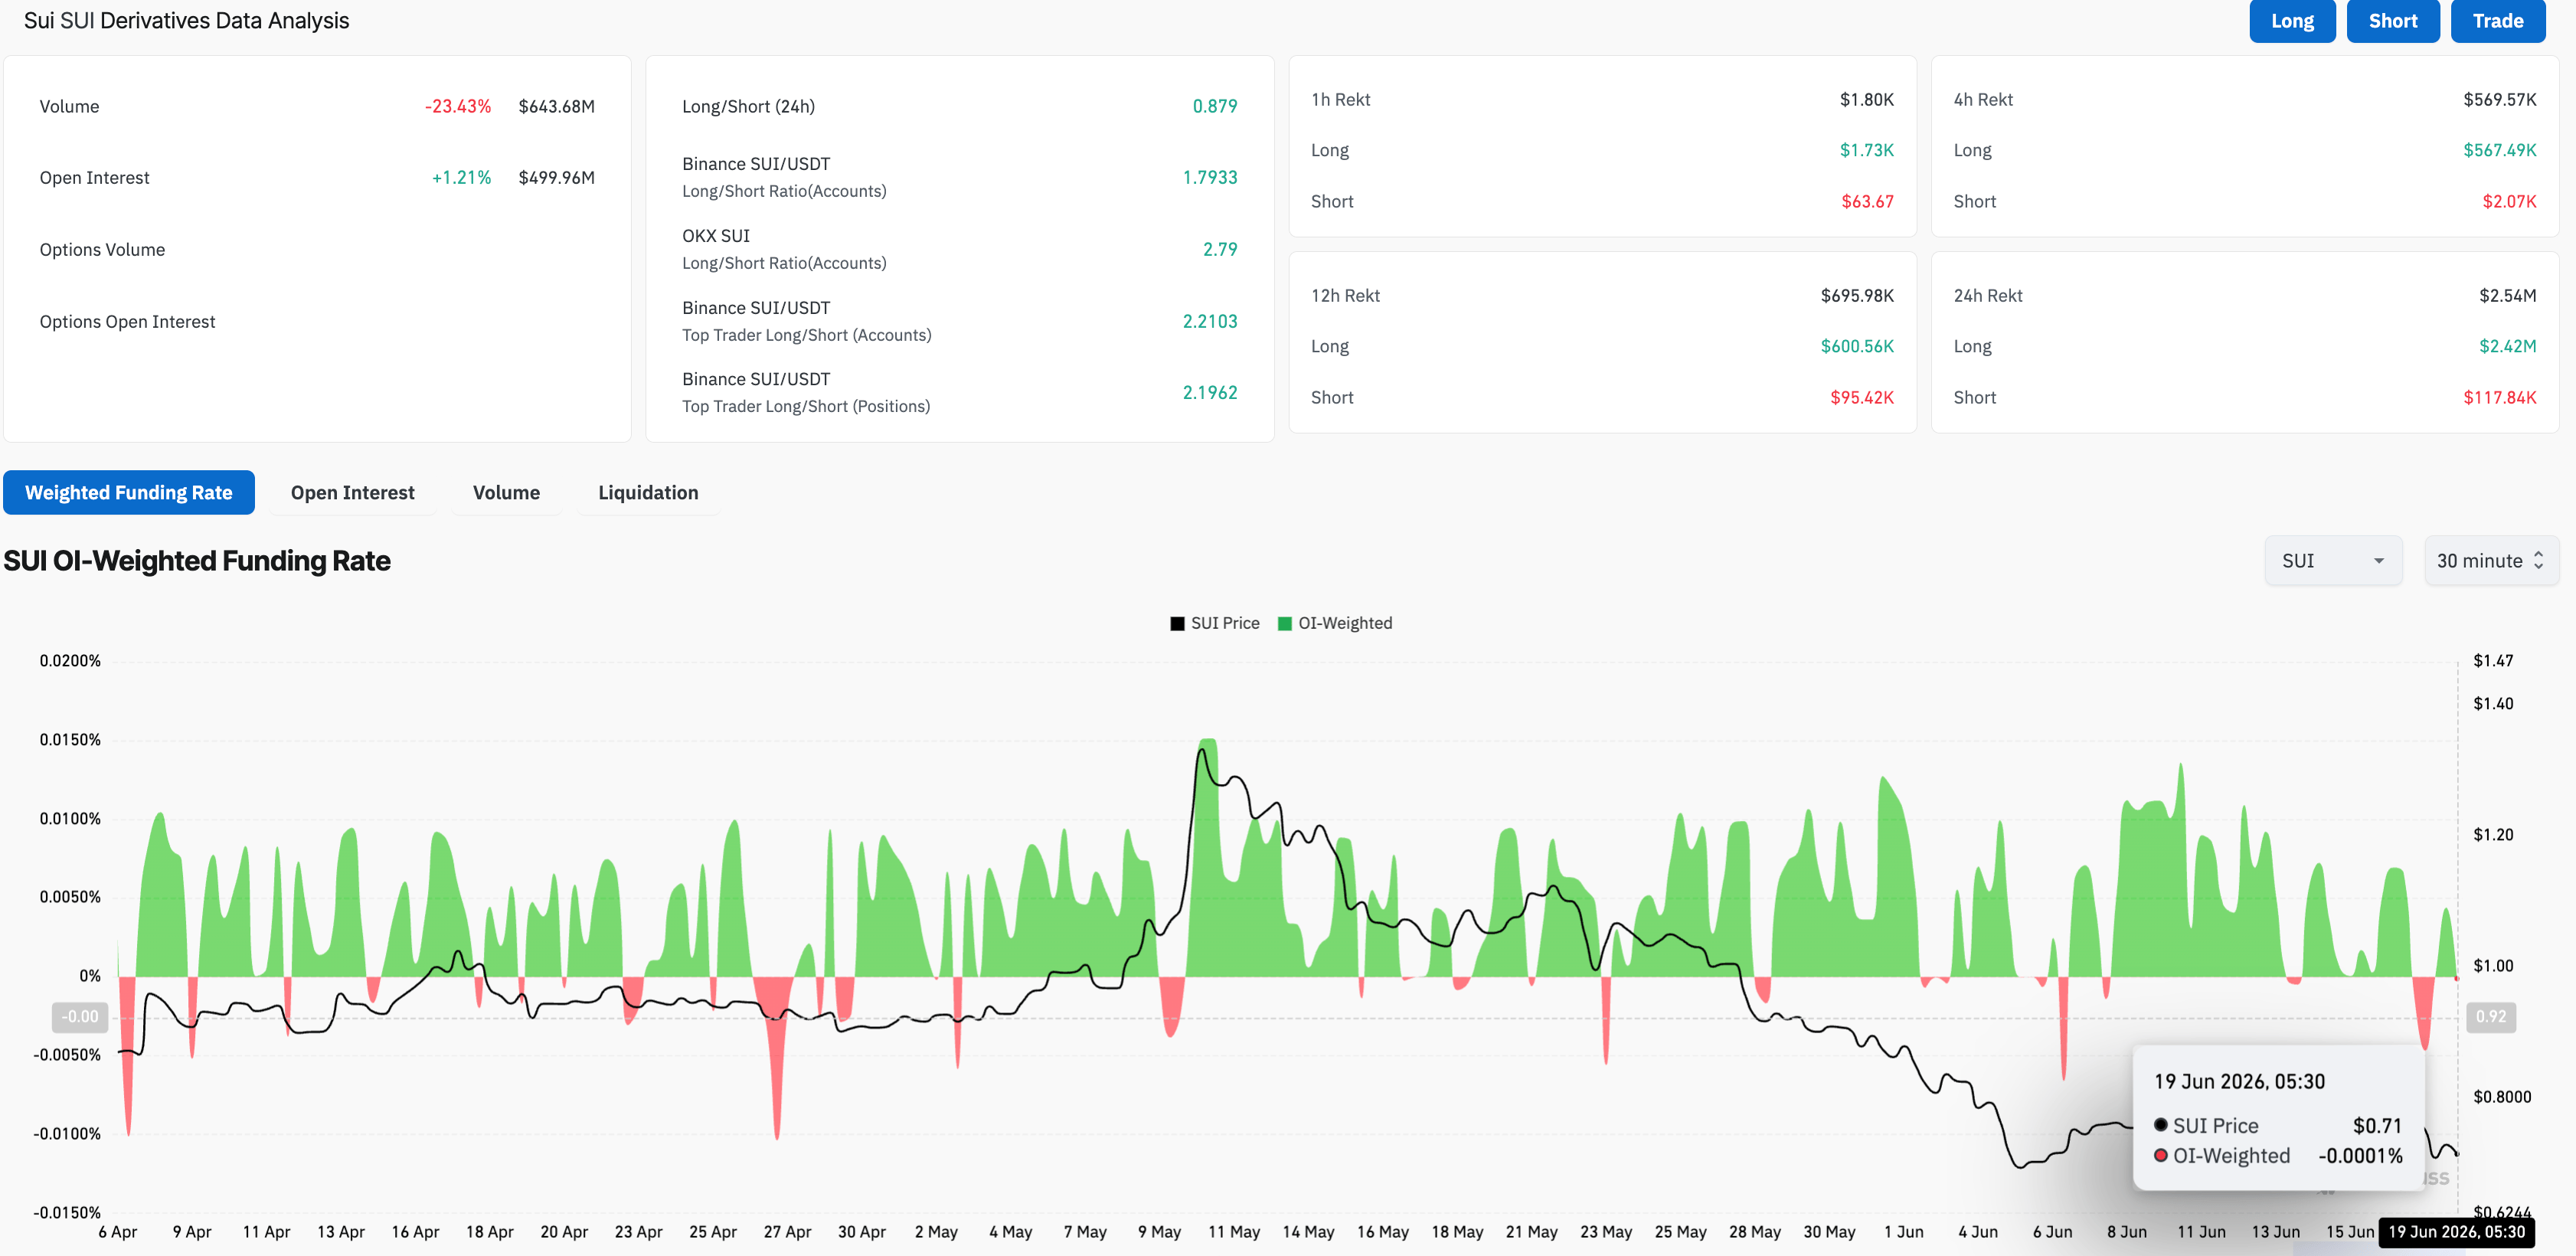
- Retail sentiment is bearish in SUI derivatives, with volume and funding rates declining even as Open Interest rises.
Sui (SUI) price continues to lose its ground for the fourth straight day, inching closer to $0.7000 at press time on Friday. On-chain data reveals network resilience with Total Value Locked (TVL) stabilizing around 600 million SUI, while the derivatives traders lean bearish as Open Interest rises amid falling volume and funding rates.
Network remains firms amid broader market sell-off
Sui is down 20% so far this month, consistent with the broader crypto market decline. However, the ecosystem’s TVL bounced back to 596.39 million SUI on Friday, reflecting a recovery trend stabilizing near the 600 million SUI mark after dipping to 497.77 million SUI on May 11. Typically, a rebound and stability in a network’s TVL reflect its underlying strength and demand.
On the derivatives side, broader market sentiment weighs on SUI traders. CoinGlass data show SUI Open Interest rising by over 1% in the last 24 hours to roughly $500 million, signaling a mild short-term positional buildup.
However, the 23% drop in trading volume to $643 million over the same period reflects reduced trading activity. Meanwhile, the funding rate has slipped marginally below zero, from 0.0044% the previous day, reflecting a shift away from traders willing to pay a premium to buy long positions.
Sui remains bearish, risking another downside leg
Sui hovers below the 20-day Simple Moving Average (SMA) at $0.7732 on Friday, extending its decline for the third consecutive day. The 50-day and 200-day Exponential Moving Averages (EMAs) at $0.8785 and $1.2618, respectively, sit well above the price, reinforcing the bearish bias.
From a technical perspective, SUI remains under pressure from a descending trendline near $0.7800, which capped its recovery on Wednesday. That said, the renewed bearish continuation in SUI risks the lower support levels, including the S1 Pivot Point at $0.6895, near the June 6 low at $0.6618.
Momentum shows a failed bullish attempt on the daily chart, as the Relative Strength Index (RSI) near 34 flips back toward the oversold zone. At the same time, the Moving Average Convergence Divergence (MACD) shows contracting histograms and converging average lines, indicating that bullish momentum is easing.
On the topside, initial resistance is located at the Bollinger Bands’ middle line and 20-day SMA near $0.7732, followed by the descending trendline break level at roughly $0.7800. Above that, a bullish inversion Fair Value Gap (FVG) between $0.8440 and $0.8568 forms a dense upside barrier.
(The technical analysis of this story was written with the help of an AI tool.)
Recommended Articles









Comments (0)
Click the $ button, enter the symbol, and select to link a stock, ETF, or other ticker.