


XRP and XLM outlook: Breakout hopes grow as bullish sentiment builds



- XRP nears the upper boundary of the downward channel on Tuesday, a breakout suggests a bullish move ahead.
- XLM approaches the key resistance level at $0.21 after surging over 11% in the previous day.
- Rising trading volume, increasing open interest and positive funding rates support a bullish outlook for both XRP and XLM.
Ripple (XRP) and Stellar (XLM) are attracting renewed bullish interest on Tuesday after gaining over 4% and 11%, respectively, at the start of this week. Both altcoins are near key resistance zones, where a breakout suggests further upside move. On-chain and derivatives data further support a positive outlook for XRP and XLM, with rising trading volumes, increasing Open Interest (OI), and positive funding rates signaling growing market participation and strengthening bullish momentum.
Derivatives data supports a bullish bias
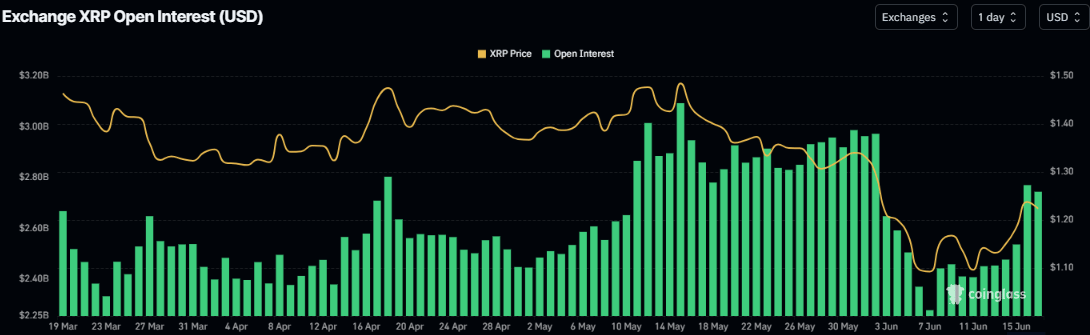
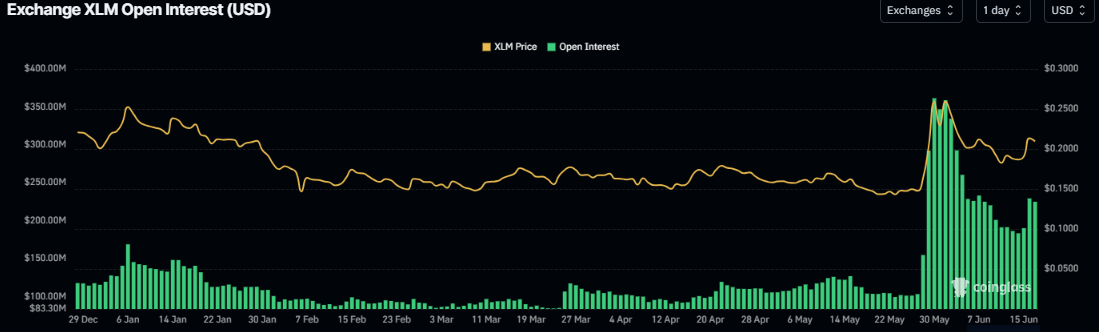
CoinGlass data show that Open Interest in XRP and XLM surged to $2.74 billion and $224 million, respectively, on Tuesday. An increase in OI indicates new or additional buying pressure entering the market, which could fuel a rally in XRP and XLM prices.
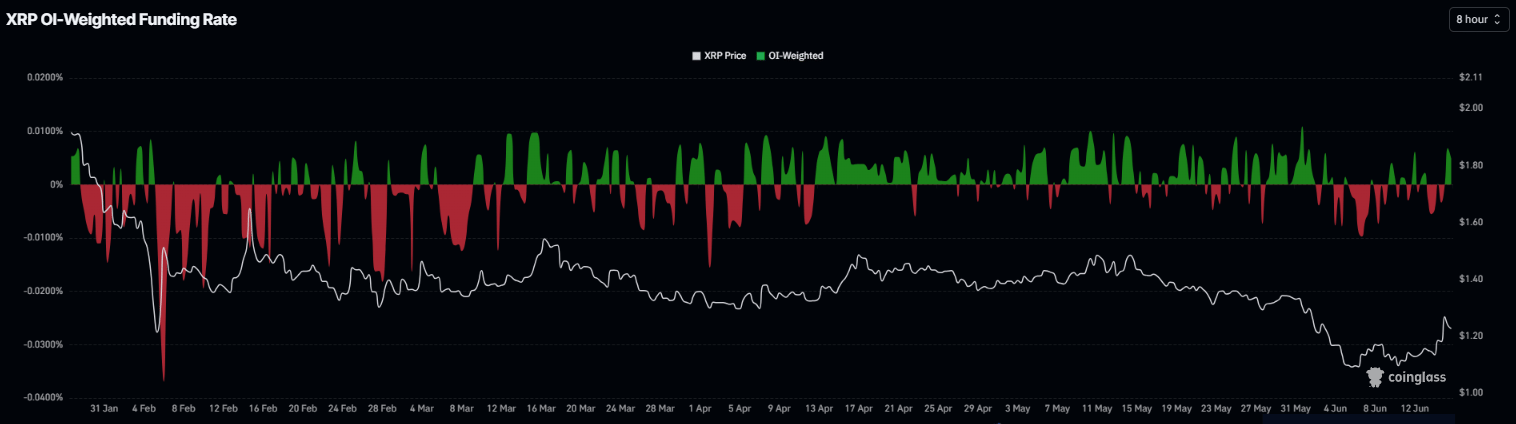
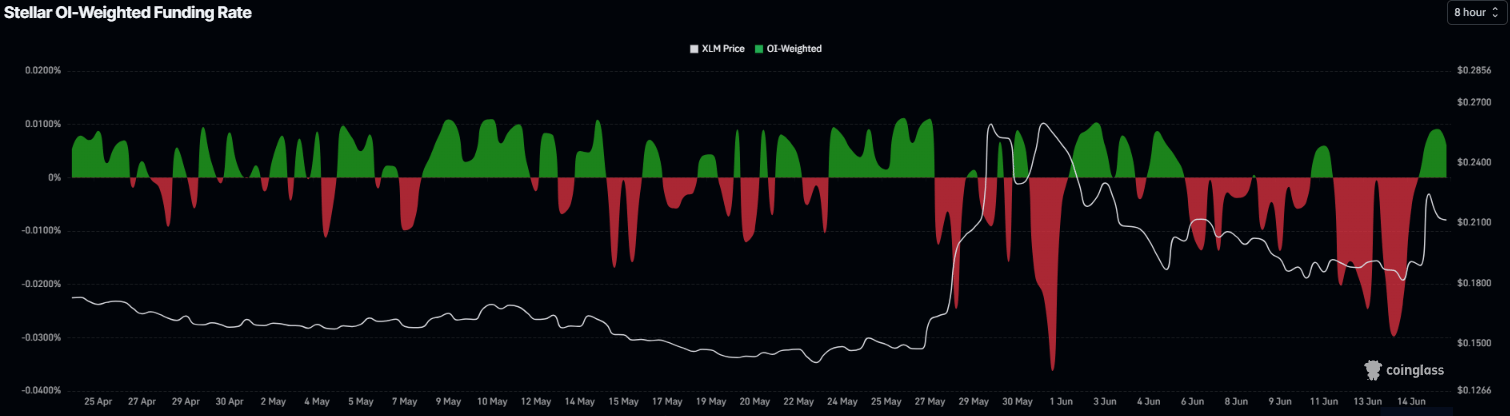
In addition to the rising open interest, the funding rates for both altcoins have also turned positive. CoinGlass’ OI-Weighted Funding Rate data for XRP and XLM read 0.0071% and 0.0061% on Tuesday, respectively, further fueling the bullish outlook.
XRP and Stellar attract bulls as participation jumps
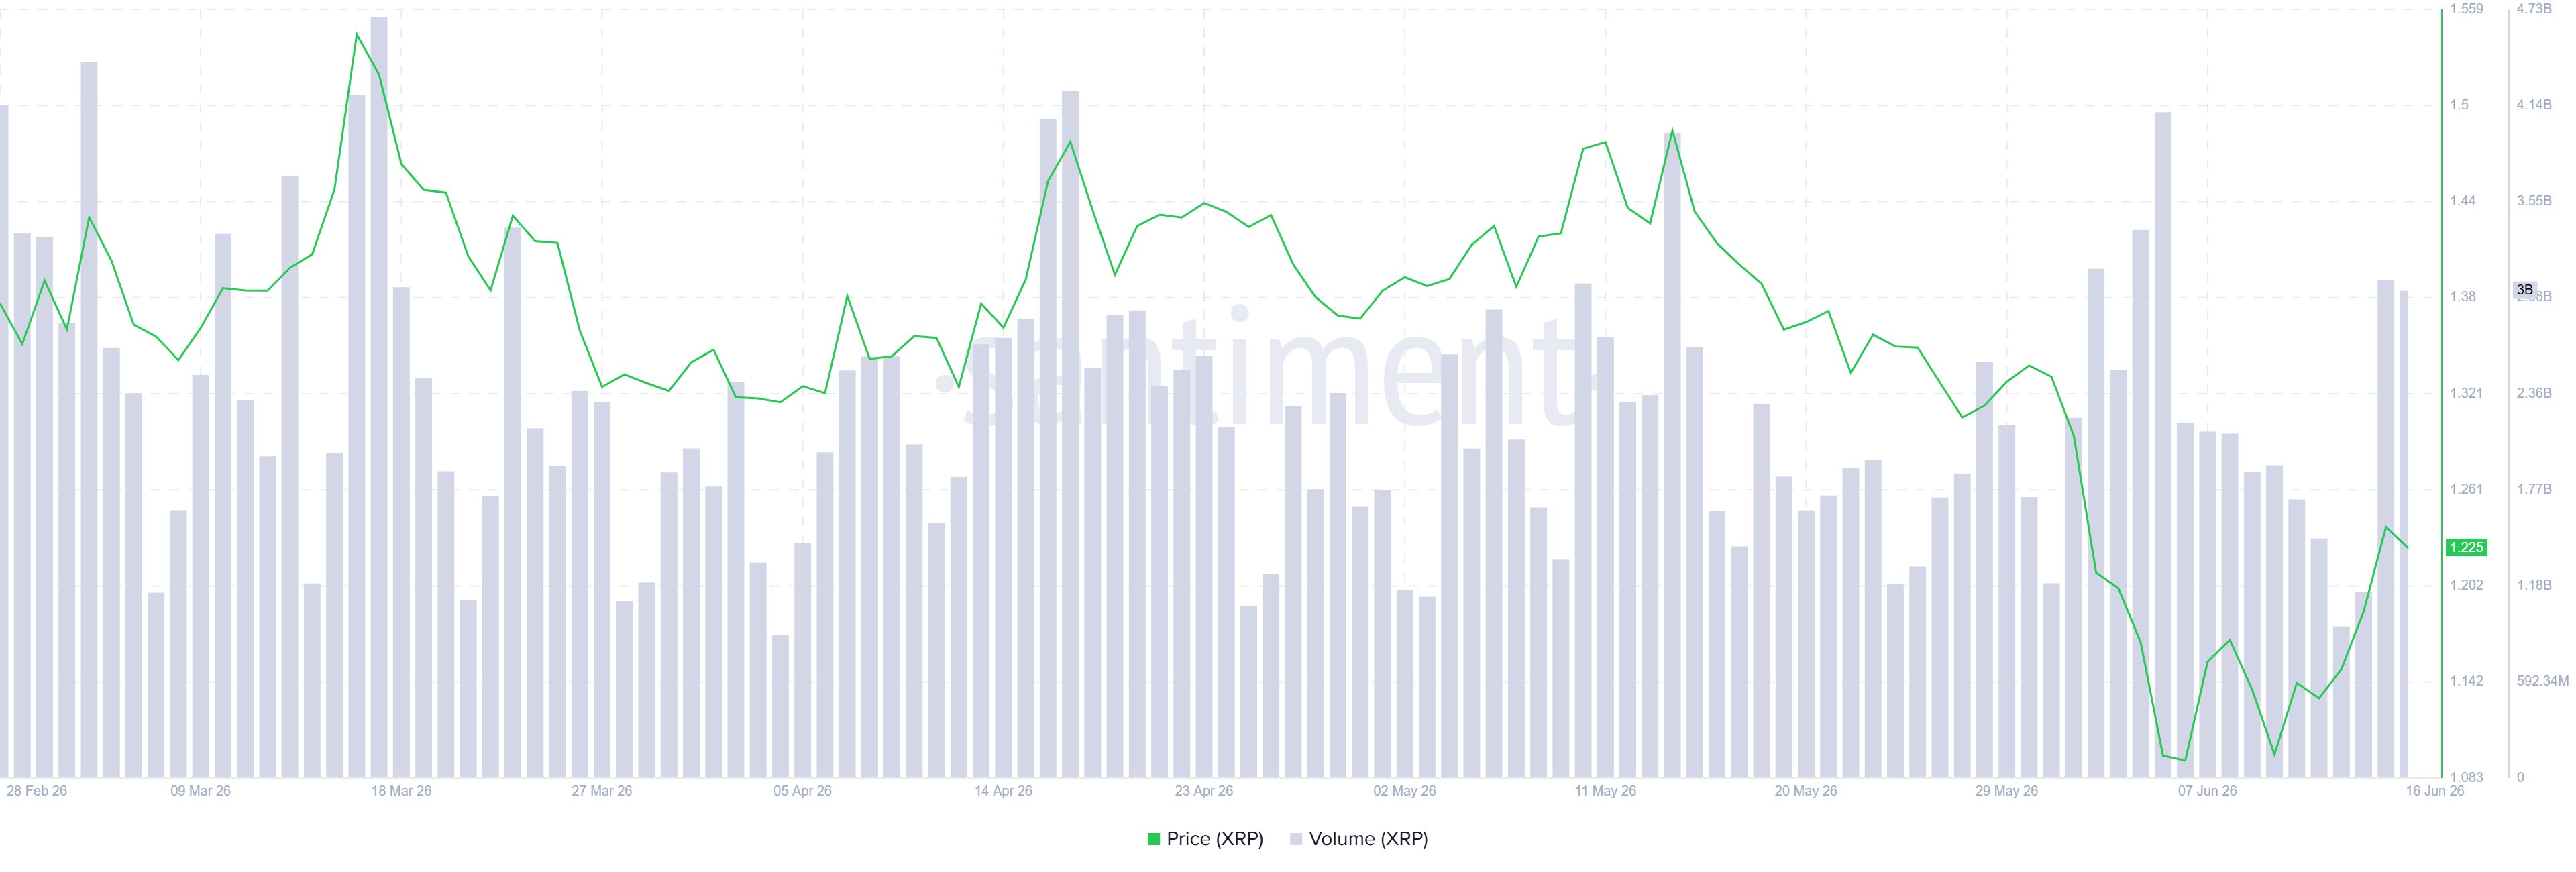
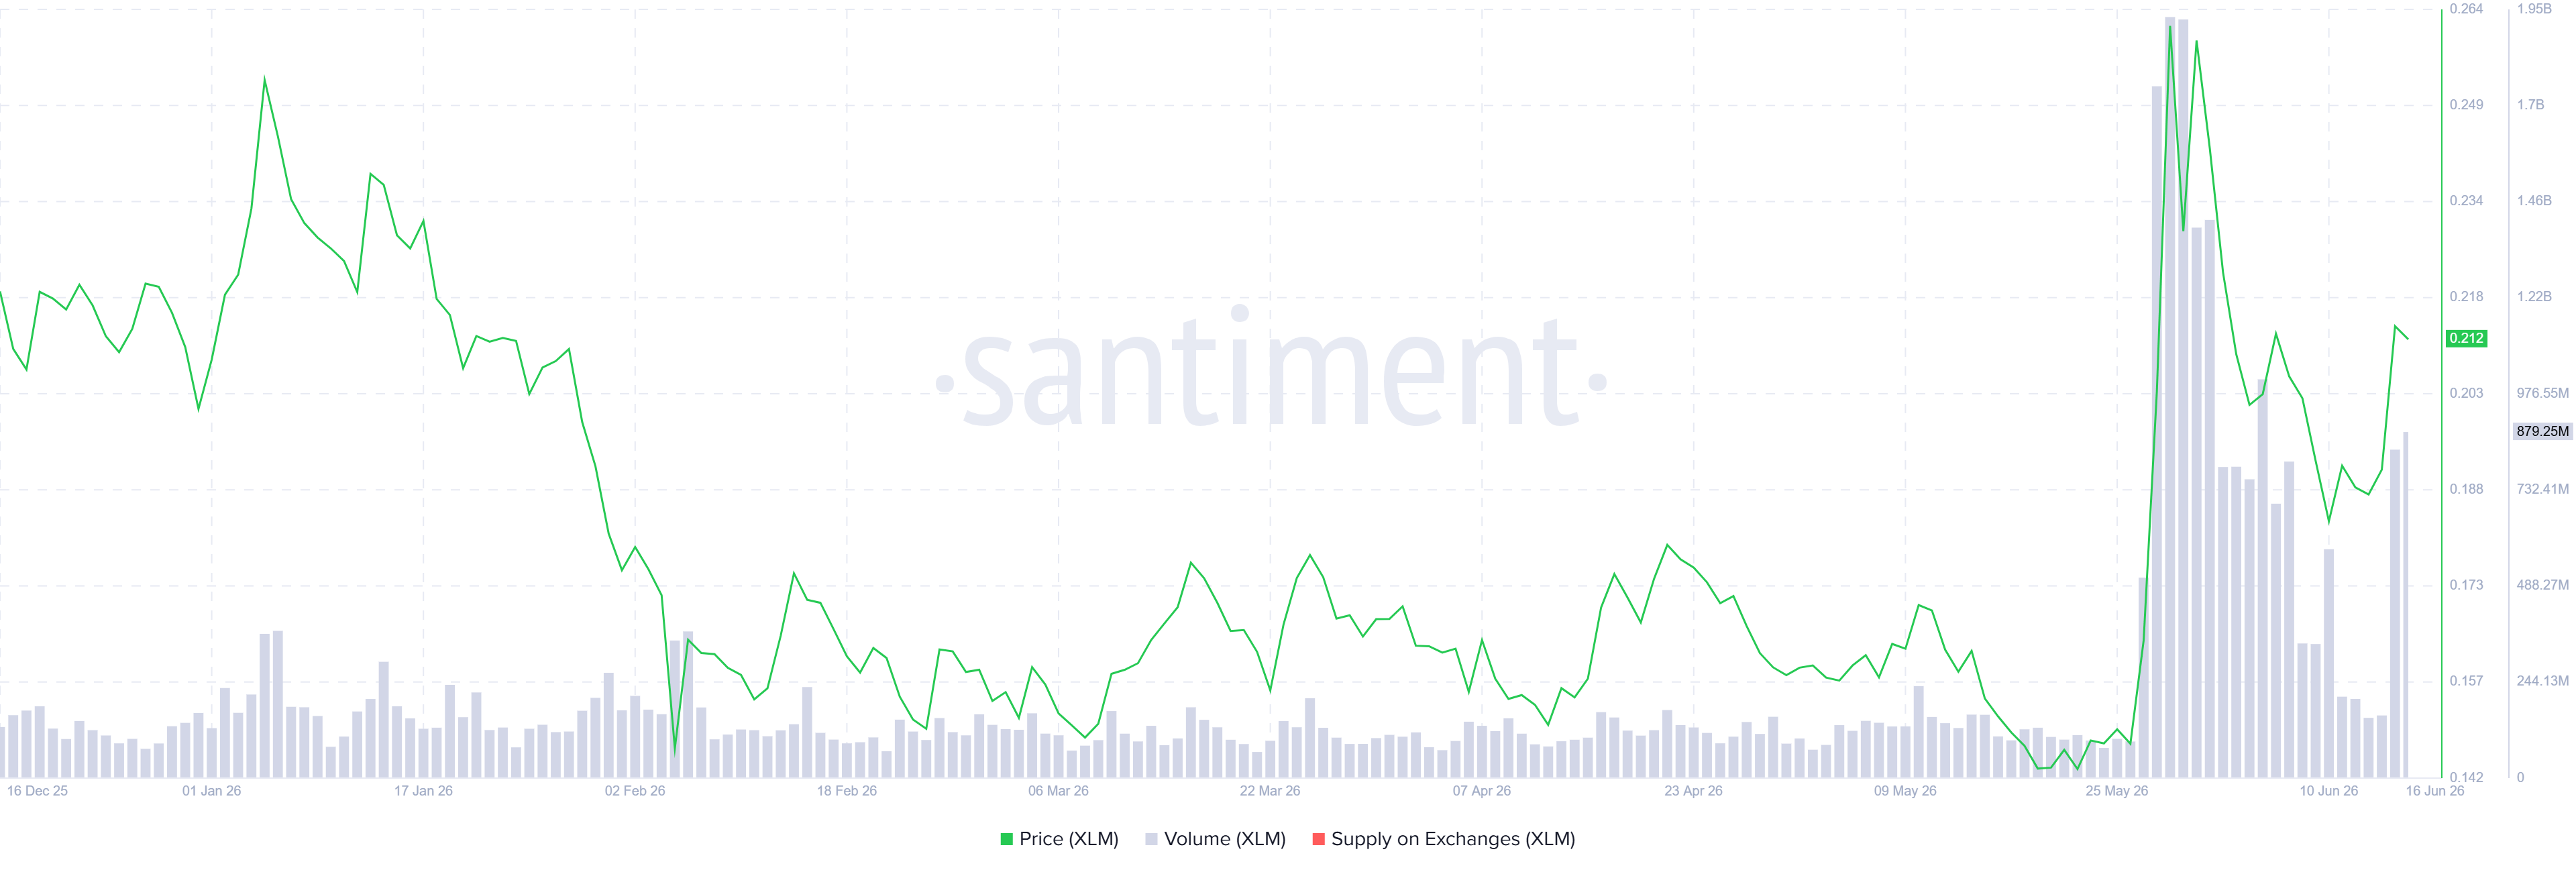
Another aspect bolstering the XRP and XLM’s bullish outlook is a recent surge in traders’ interest and liquidity in their respective networks. Santiment data shows that XRP’s trading volume rose to $3 billion on Tuesday from $932 million on Saturday. Similarly, for XLM, trading volume surges to $879.25 million on Tuesday from $153 million on Saturday.
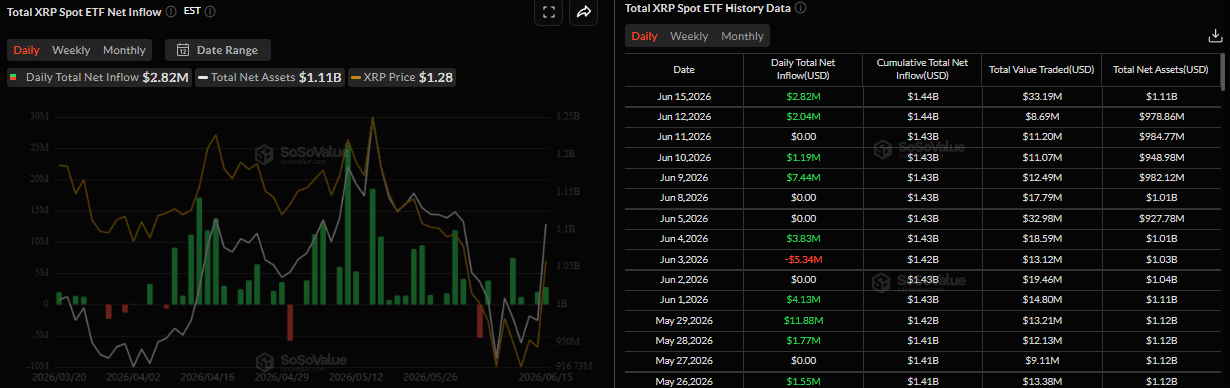
SoSoValue data shows some signs of optimism. Spot Exchange Traded Funds (ETFs) recorded an inflow of $2.82 million on Monday, marking the second consecutive day of inflow since last week. If this inflow trend continues and intensifies, XRP could see a recovery ahead.
XRP technical outlook: Near the upper channel boundary
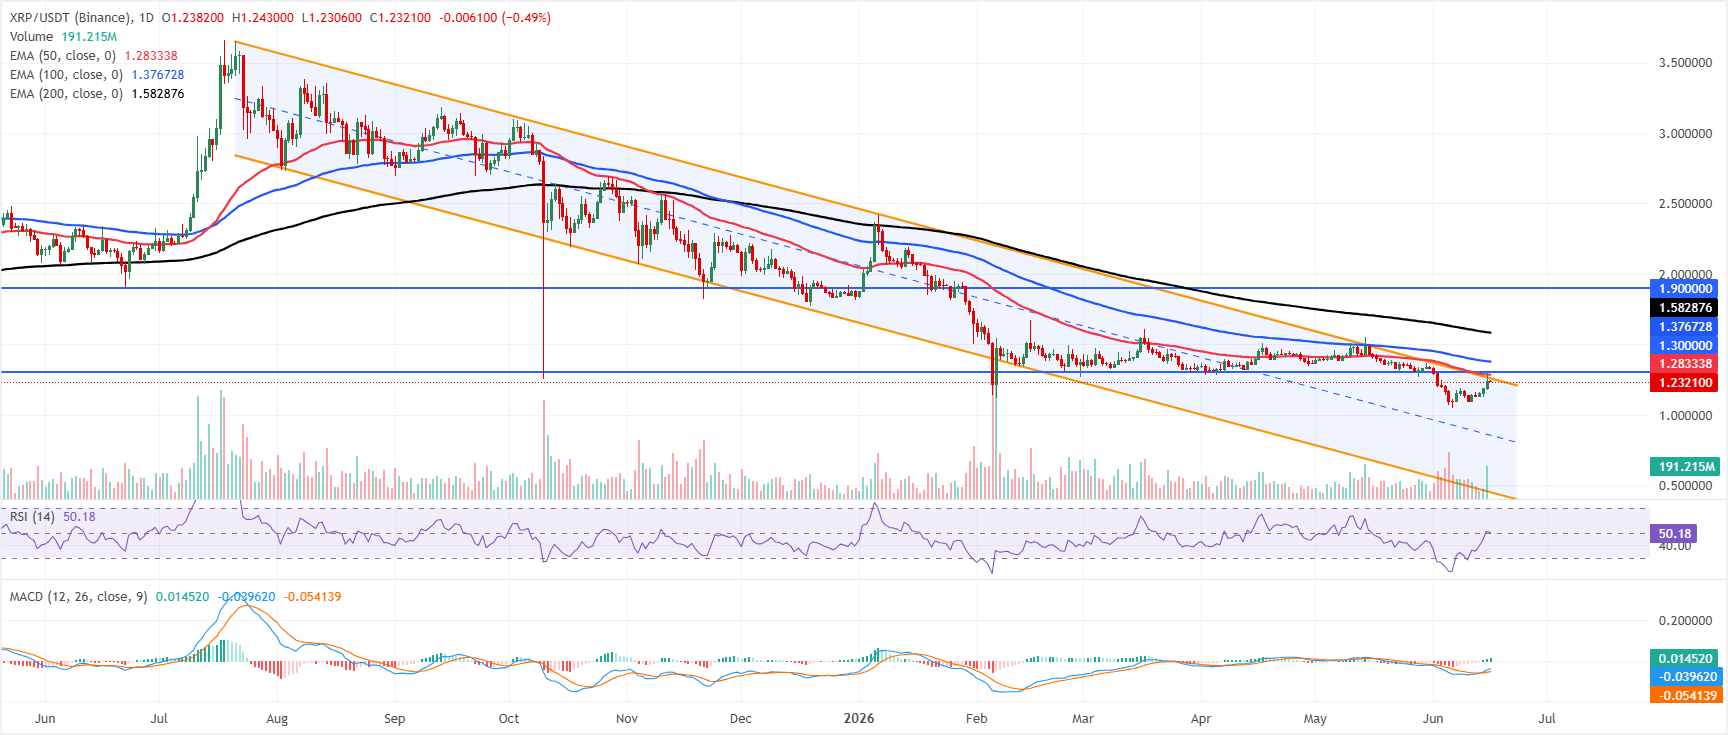
XRP trades at $1.232 on Tuesday, up over 4% from the previous day. However, XRP is maintaining a cautious tone as the price remains below the 50-day, 100-day, and 200-day Exponential Moving Averages (EMAs) at $1.283, $1.376, and $1.582, respectively.
XRP has rebounded from deeply oversold readings, with the Relative Strength Index (RSI) hovering around the neutral 50 area and the Moving Average Convergence Divergence (MACD) turning positive, yet these improving momentum signals merely hint at corrective upside within a broader capped structure dominated by overhead trend and channel resistance.
On the topside, initial resistance is aligned with the upper boundary of the prevailing downward parallel channel near $1.258, followed by the 50-day EMA at $1.283 and the horizontal barrier at $1.300. Above these, the 100-day EMA at $1.376 and the 200-day EMA at $1.582 form a wider supply band ahead of the more distant horizontal resistance around $1.900, levels that would need to be decisively reclaimed to challenge the current bearish technical backdrop; with no nearby chart-based support levels below spot, any renewed selling would likely expose psychological and prior swing lows that are not explicitly defined in the present dataset.
XLM technical outlook: Momentum indicators show fading bearish strength
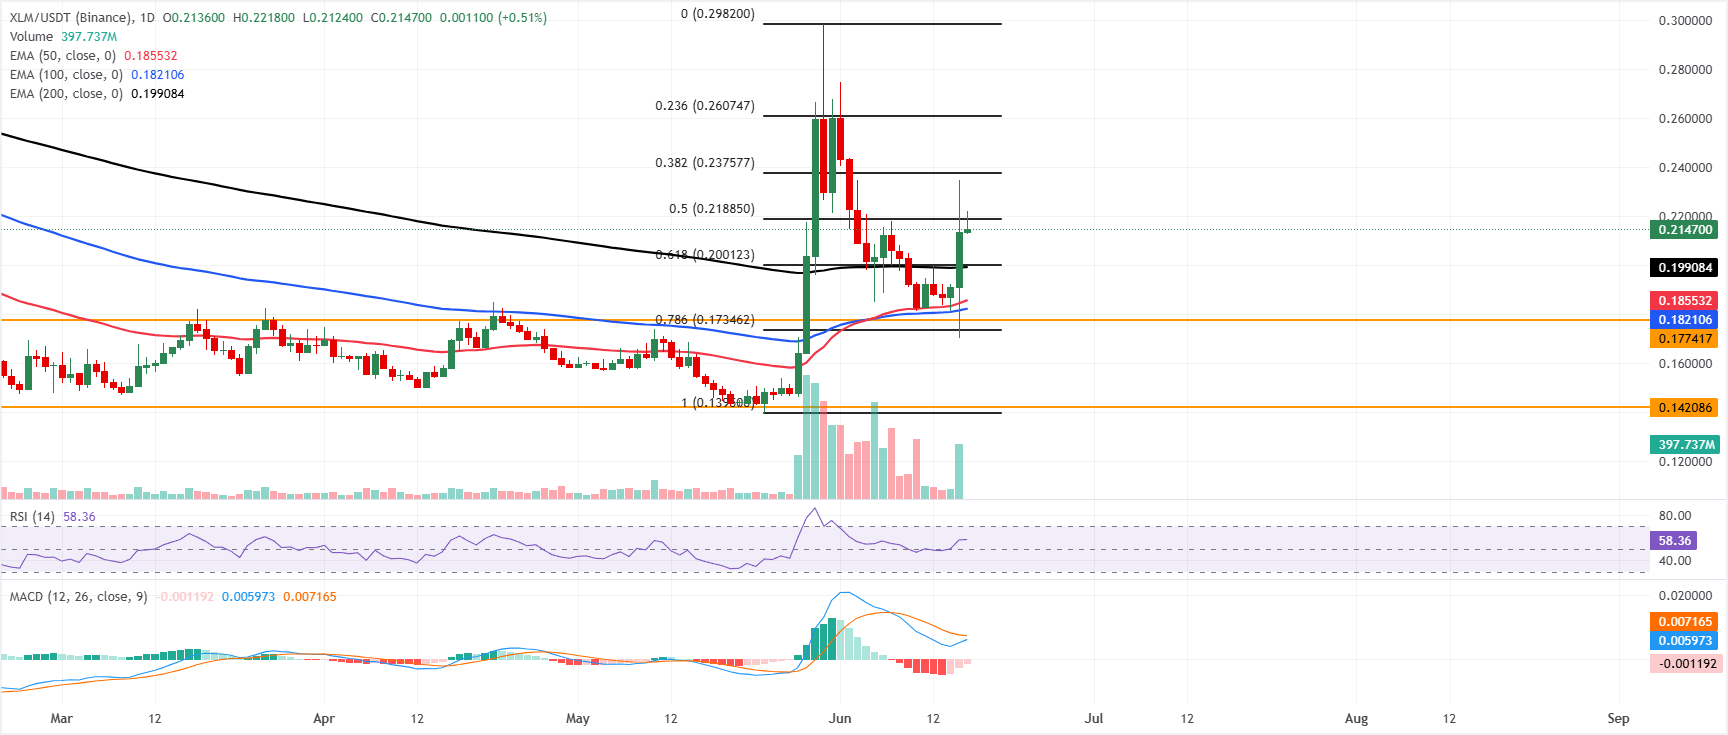
XLM trades at $0.214 on Tuesday, holding a constructive bullish bias after rebounding from last week’s pullback. XLM is trading above a dense support band formed by the 61.8% Fibonacci retracement at $0.200 and the 200-day EMA near $0.199, while the 50-day and 100-day EMAs at $0.185 and $0.182, respectively, sit further below and reinforce the underlying uptrend structure.
The RSI on the daily chart around 58 suggests positive but not overstretched momentum, and the MACD indicator, though still slightly below the zero line, has been grinding higher, hinting that bearish pressure is fading.
On the topside, initial resistance is aligned at the 50.0% retracement of the latest swing at $0.218; a daily close above this barrier would open the way toward the next Fibonacci hurdles at $0.237 and then $0.260.
On the downside, immediate protection is seen at the $0.200 – $0.199 area, where the 61.8% retracement converges with the 200-day EMA, with additional demand expected near the cluster of moving averages around $0.185 – $0.182 and the horizontal support at $0.177; a break below these latter levels would expose deeper support at $0.173 and $0.142.
(The technical analysis of this story was written with the help of an AI tool.)
Recommended Articles







Comments (0)
Click the $ button, enter the symbol, and select to link a stock, ETF, or other ticker.