


Crypto Overview: Bitcoin is back under $62,000 – Hyperliquid, DeXe lead losses



- Bitcoin hovers below $62,000 on Wednesday, after a 2% decline the previous day.
- Renewed tensions in the Middle East, with the US launching its third wave of strikes on Iran, weigh on Bitcoin.
- Hyperliquid and DeXe are leading losses over the last 24 hours.
The broader cryptocurrency market is under pressure with Bitcoin (BTC) slipping below $62,000 on Wednesday amid the US launching its third wave of strikes on Iran. Hyperliquid (HYPE) and DeXe (DEXE) are leading losses over the last 24 hours, risking the prevailing upward trend.
US-Iran stress weighs back on Bitcoin
Bitcoin dropped below $62,000 on Tuesday, failing to extend the clean rebound seen during the previous retest of the $60,000 mark in early February. The recent sell-off triggered by the stronger-than-expected US Jobs data now faces the additional weight of the renewed US-Iran tensions. US Central Command (CENTCOM) launched strikes against Iran in response to the downing of a US Army Apache helicopter.

Bitcoin maintains a bearish near-term bias as price holds well below the 50-, 100-, and 200-day Exponential Moving Averages, which now stack as overhead resistance from around $72,045 up to $79,295. From a technical perspective, the failure above the former rising support trendline, now turned into resistance near $72,163, underscores a broken medium-term uptrend.
That said, the Relative Strength Index (RSI) at roughly 24 sits in oversold territory while the Moving Average Convergence Divergence (MACD) and its signal line remain negative, both hinting that while downside pressure persists, the pace of the decline could start to moderate.
On the downside, the key level to watch is the horizontal support around $60,000, where buyers previously emerged. A clear break and daily close below this floor would open the door to an extension of the current downtrend, whereas sustained defense of 60,000 could allow for a corrective bounce back toward the aforementioned resistance band.
Looking up, the immediate resistance aligns with the March 29 low at $65,000, followed by the April 12 low of $70,505.
Hyperliquid risks losing the $50 threshold
Hyperliquid extends losses toward the $50 mark at press time on Wednesday, following a 9% drop the previous day. HYPE risks losing a constructive bullish bias, which remains supported by a cluster of underlying moving averages, with the 50-day EMA at $53.74, the 100-day EMA at $47.18, and the 200-day EMA at $41.48.
Though the EMAs suggest an intact broader uptrend, momentum has cooled on the daily chart with the recent pullback. The RSI is hovering near a neutral 48, and the MACD and signal lines fall toward the zero line after a bearish crossover on Friday, suggesting waning upside pressure rather than an outright trend reversal.
On the downside, immediate support is seen at the 50-day EMA at $53.74, followed by the 78.6% Fibonacci retracement at $51.11, measured from the $59.45 to $2.51 downswing.
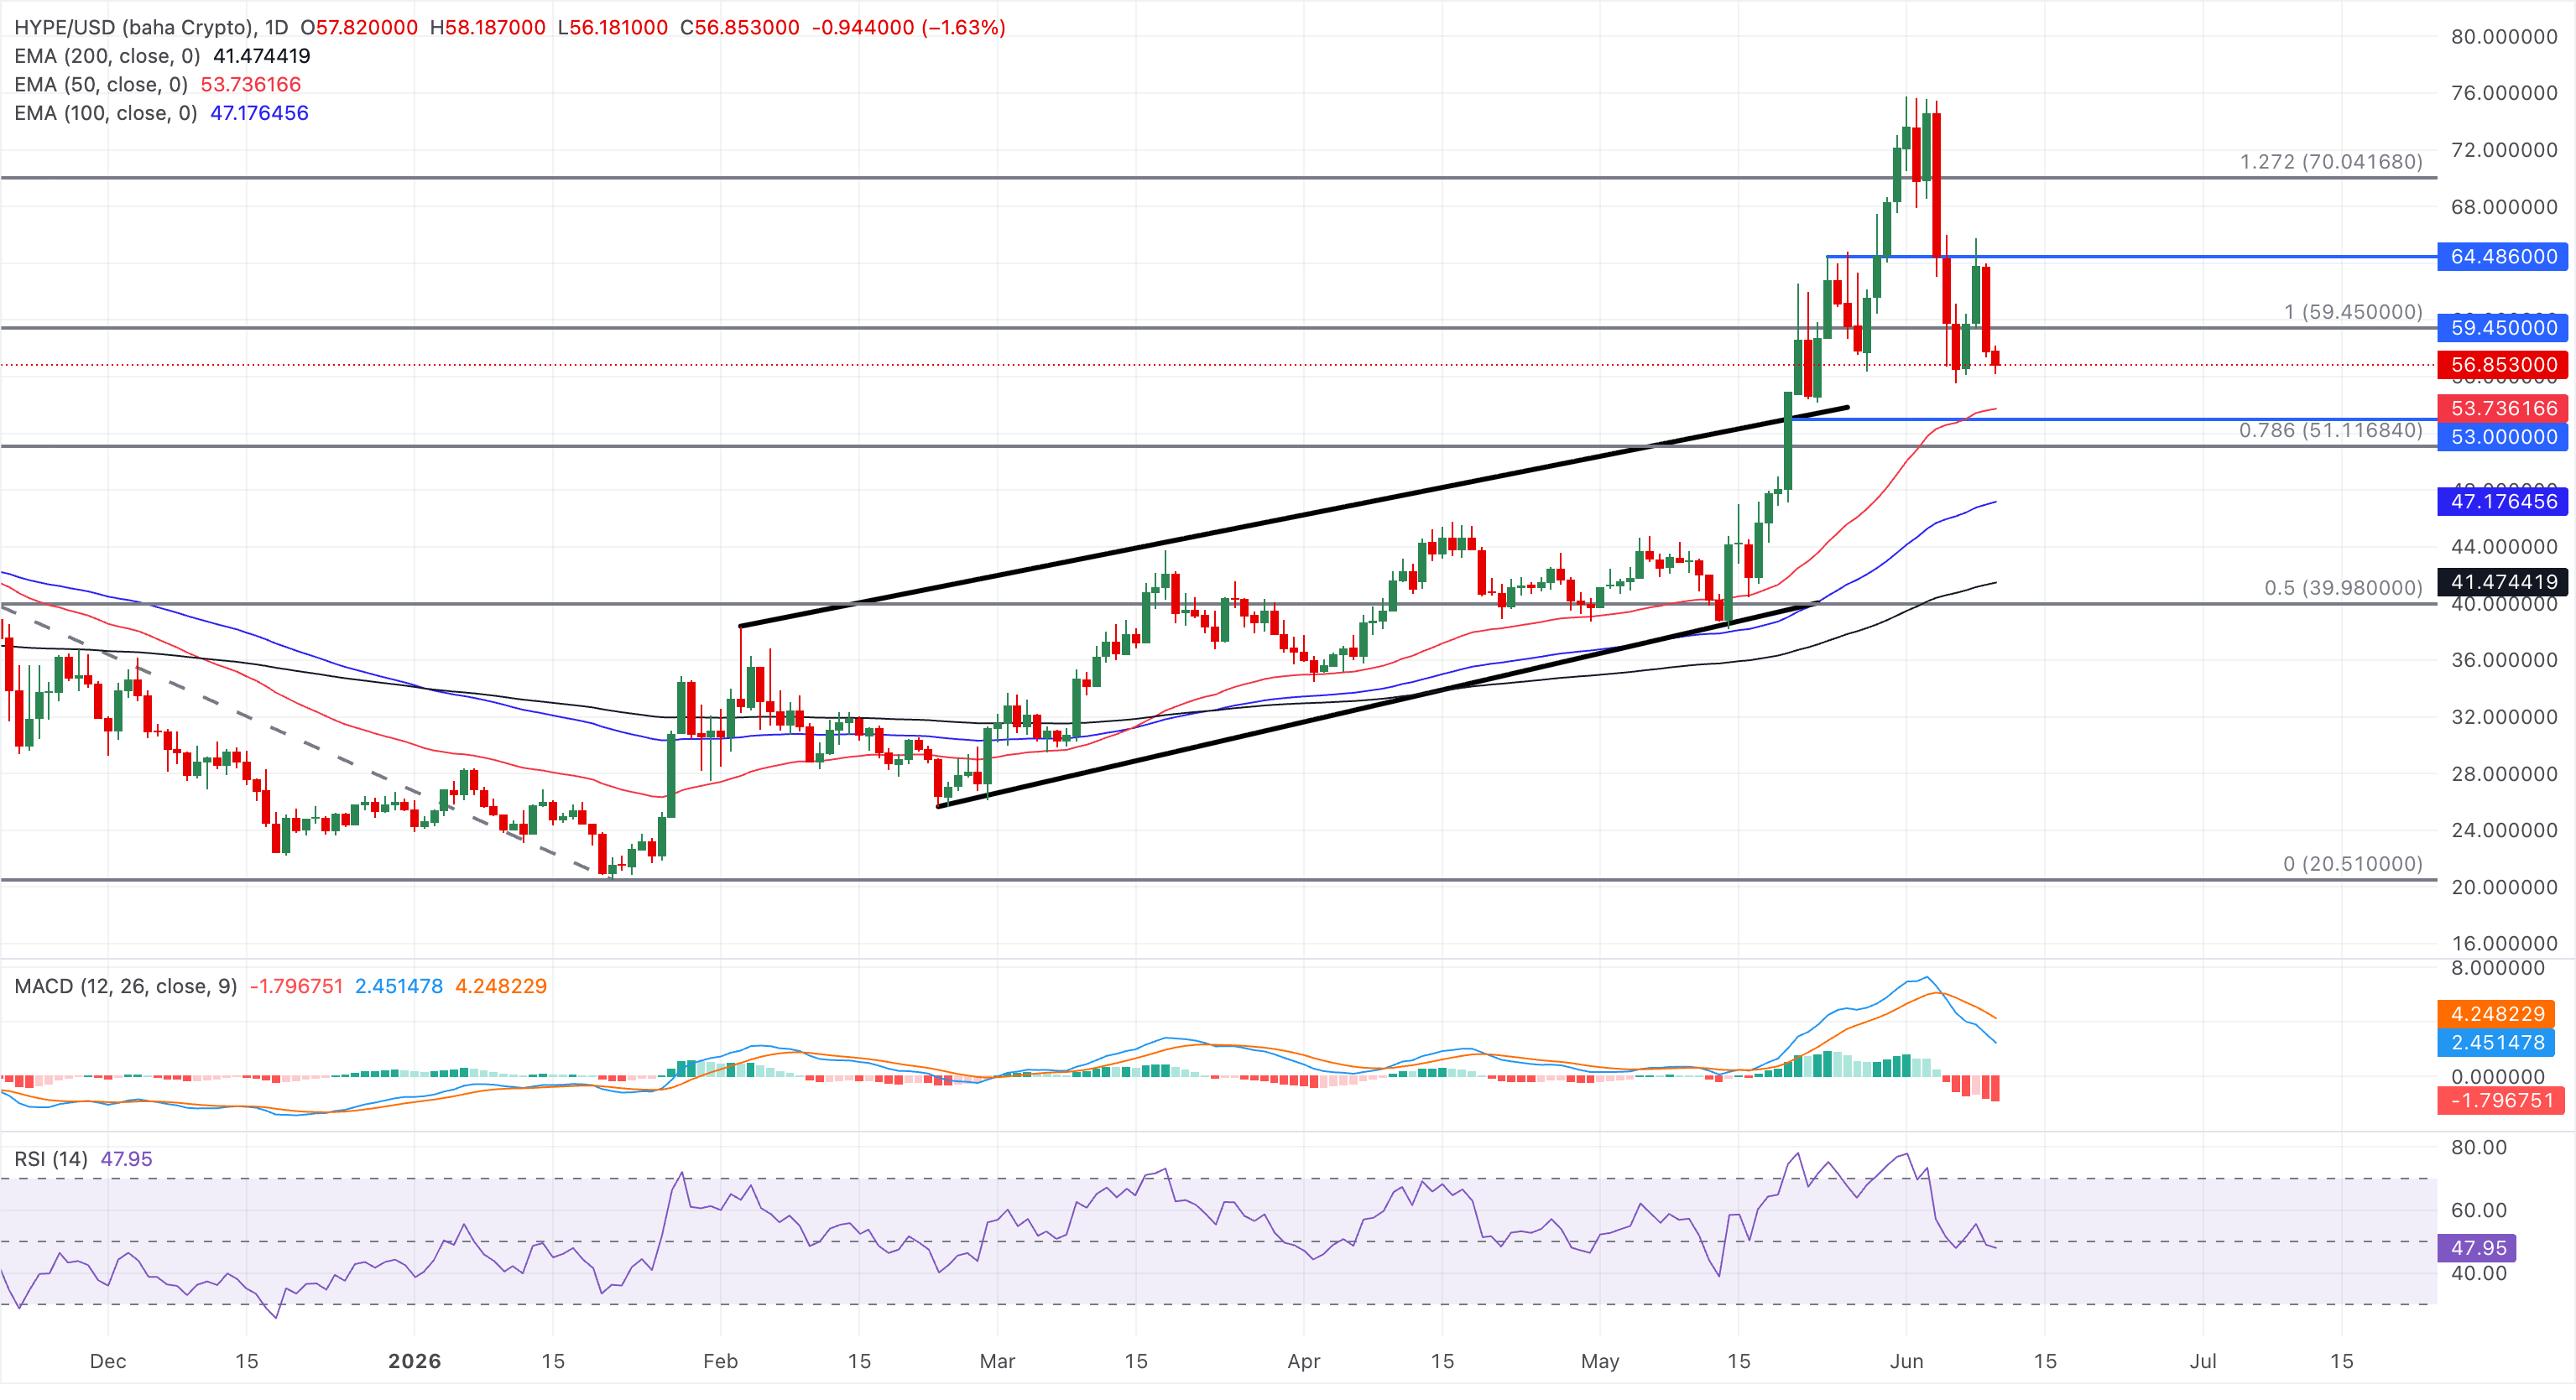
On the topside, initial resistance is aligned with the 100% Fibonacci retracement at $59.45, where a clear break would reopen the path toward the 127.2% Fibonacci extension level at $70.04.
DeXe's reversal puts a prolonged uptrend at risk
DeXe maintains a bullish near-term bias as price holds well above the 50-, 100-, and 200-day EMAs at $15.19, $12.20, and $9.78, respectively, which act as the underlying support structure.
However, the MACD has slipped marginally below the signal line, signaling a bearish crossover and hinting at a potential renewal of bearish momentum. Meanwhile, the RSI near 59 reflects constructive momentum as overbought conditions wane.
On the downside, initial support is seen at the 50-day EMA near $15.19, with deeper downside exposure pointing to the 100-day EMA around $12.20 and then the 200-day EMA near $9.79 if selling pressure accelerates. As long as DEXE/USDT holds above the 50-day EMA, pullbacks are likely to be treated as corrective within the prevailing uptrend, while a daily close below this level would weaken the bullish structure and expose a broader retracement towards the lower moving average supports.
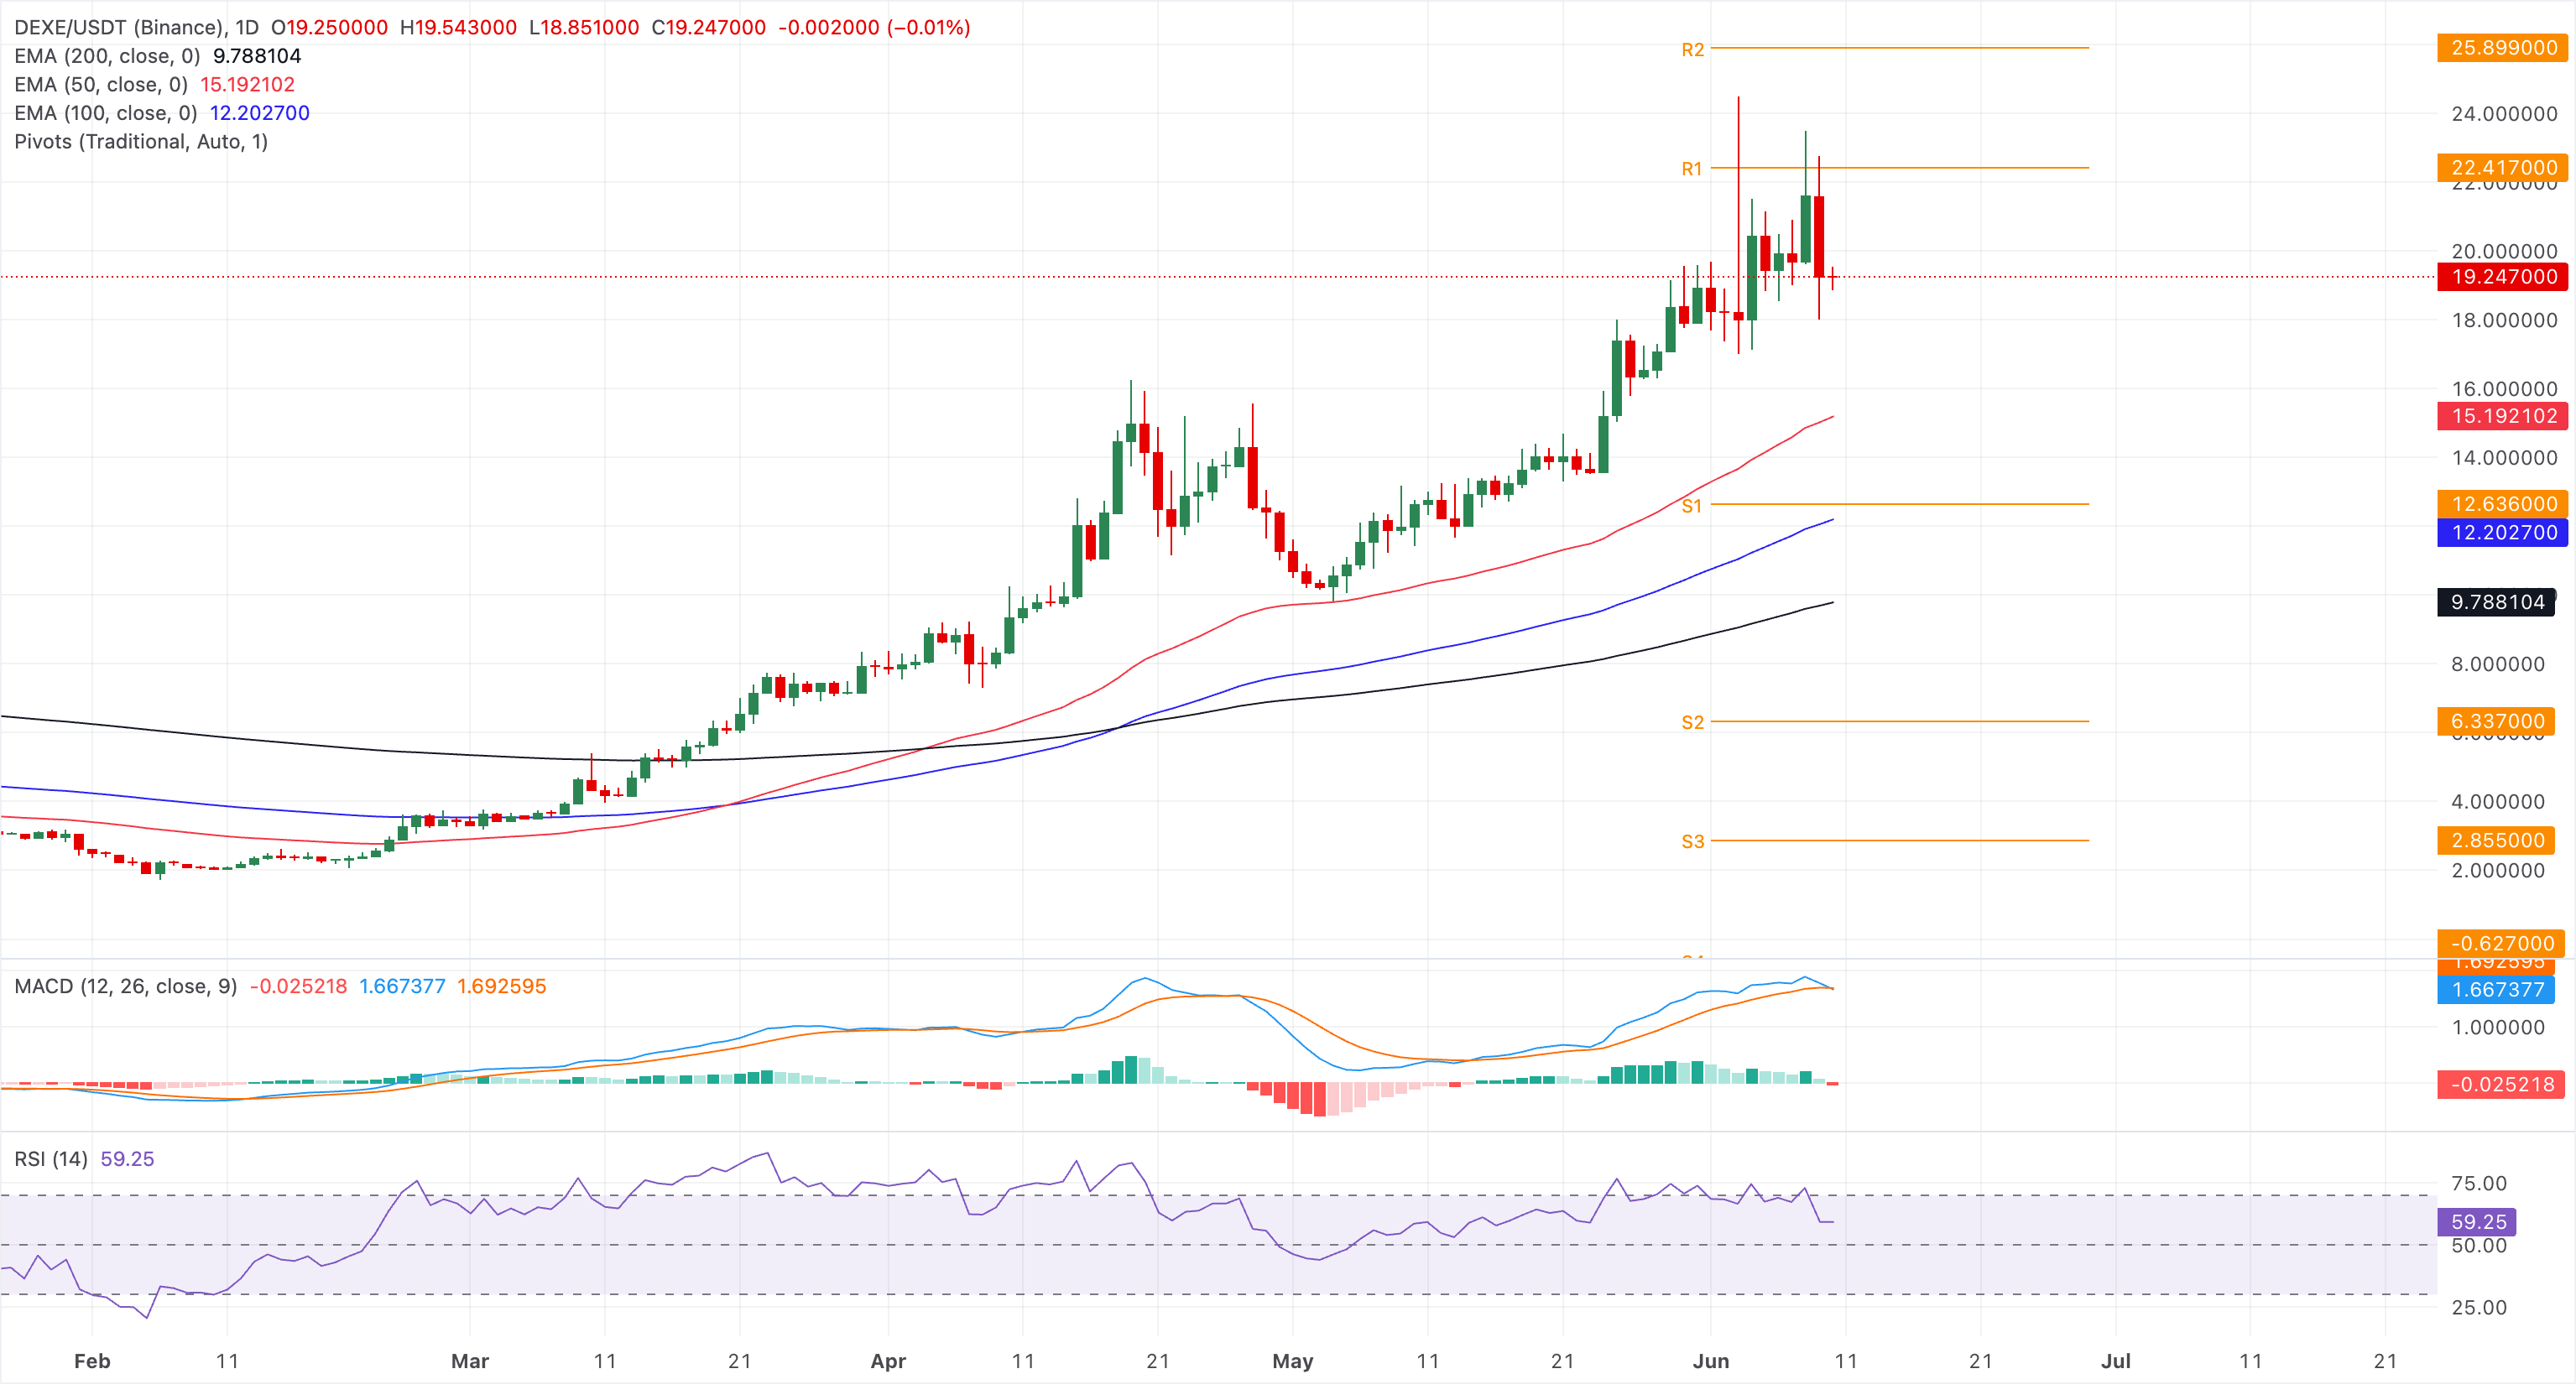
A potential rebound in DEXE could test the R1 Pivot Point at $22.41, which capped the bullish recovery attempt on Monday.
(The technical analysis of this story was written with the help of an AI tool.)
Recommended Articles








Comments (0)
Click the $ button, enter the symbol, and select to link a stock, ETF, or other ticker.