


Pi Network Price Forecast: PI extends bearish trend as low volumes stall recovery



- Pi Network is down 2% on Monday, retracing after a two-day recovery streak.
- A declining trend in trading volume reflects a lack of retail demand to absorb the unlocked supply.
- The technical outlook for PI is bearish as the sellers cap the recovery at the $0.1300 round figure.
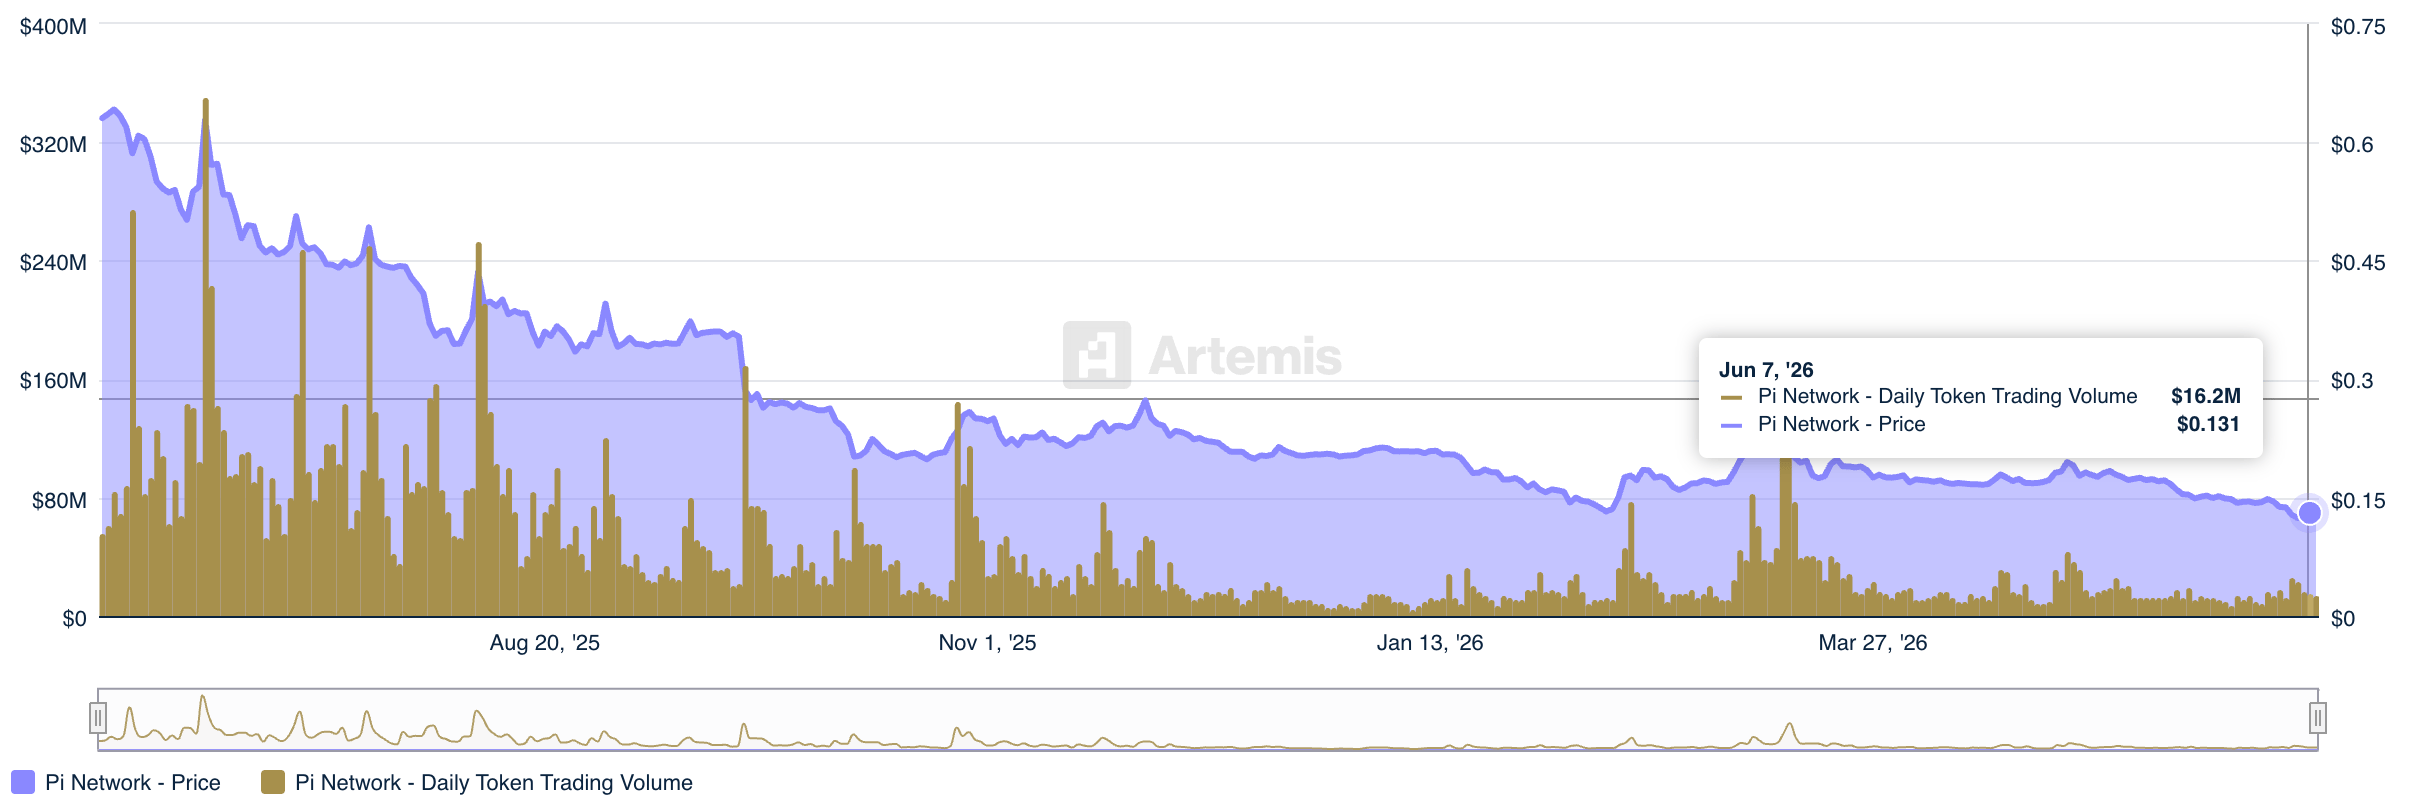
Pi Network (PI) price hovers below $0.1300 at press time on Monday, following its sixth consecutive weekly loss of 12%. A declining trend in trading volume shadows the falling PI token prices, reflecting weak demand failing to absorb supply pressure. Technically, the downside risk persists as PI remains under the influence of a long-term resistance trendline.
Vanishing liquidity weighs on PI
Pi Network remains in a long-term bearish spiral, recording a fresh low of $0.1184 on Saturday. Artemis data show shorter trading volume spikes that supported minor recoveries over the last year, reflecting declining retail demand. Taken together, the declining price and volume spikes indicate that Pi Network is a weak-momentum crypto asset, with further downside risk if the broader market risk-off sentiment weighs in.
Technical outlook: Could the PI token price drop to a fresh record low?
Pi Network slips below $0.1300 at press time on Monday, extending its decline beneath the crucial 50-, 100-, and 200-day Exponential Moving Averages at $0.1549, $0.1676, and $0.2142, respectively, and preserving a clear bearish bias. From a technical perspective, the descending trendline formed by connecting the highs of March 13 and April 19 reinforces a dominant downside structure.
That said, momentum signals remain weak on the daily chart, with the Relative Strength Index (RSI) hovering around 30, just above oversold territory, while the Moving Average Convergence Divergence (MACD) remains deep in negative territory, suggesting that selling pressure still prevails.
The PI token's reversal from the S1 Pivot Point at $0.1305, coinciding with the February 6 low, suggests a post-retest downside. The immediate support lies at the $0.1184 low from Saturday, followed by the S2 Pivot Point at $0.1124.
On the topside, initial resistance beyond $0.1305 emerges at the descending trendline with a break area near $0.1478, ahead of the 50-day EMA around $0.1549.
(The technical analysis of this story was written with the help of an AI tool.)
Recommended Articles








Comments (0)
Click the $ button, enter the symbol, and select to link a stock, ETF, or other ticker.