


Dogecoin, Shiba Inu and Pepe slide as meme coin correction gathers pace



- Dogecoin trades in red on Monday after falling over 6% in the previous week.
- Shiba Inu closes below the lower boundary of its consolidation range around $0.000056, signaling a deeper correction.
- Pepe slips near the daily support at $0.0000035, a firm close below suggests further losses.
Meme coins remain under pressure on Monday as Dogecoin (DOGE), Shiba Inu (SHIB) and Pepe (PEPE) struggle after losing over 6%, 2% and 2.5% in the previous week. DOGE and SHIB slip below their key support zone. Meanwhile, PEPE edges toward the support zone, where a close below would suggest a deeper correction.
Dogecoin faces rejection from key resistance zones
Dogecoin’s price failed to close above the key 100-day Exponential Moving Average (EMA) at $0.105 on Thursday and declined by over 3% the next day. DOGE closed below the 50-day EMA at $0.103 and struggled below it during the week. At the time of writing on Monday, DOGE trades below this resistance at $0.102.
If DOGE continues to correct, it could extend the losses toward the key psychological level at $0.100.
The Relative Strength Index (RSI) on the daily chart reads 44, below the neutral level of 50, indicating bearish momentum gaining traction. The Moving Average Convergence Divergence (MACD) also showed a bearish crossover on May 16, which remains intact, supporting the bearish outlook.
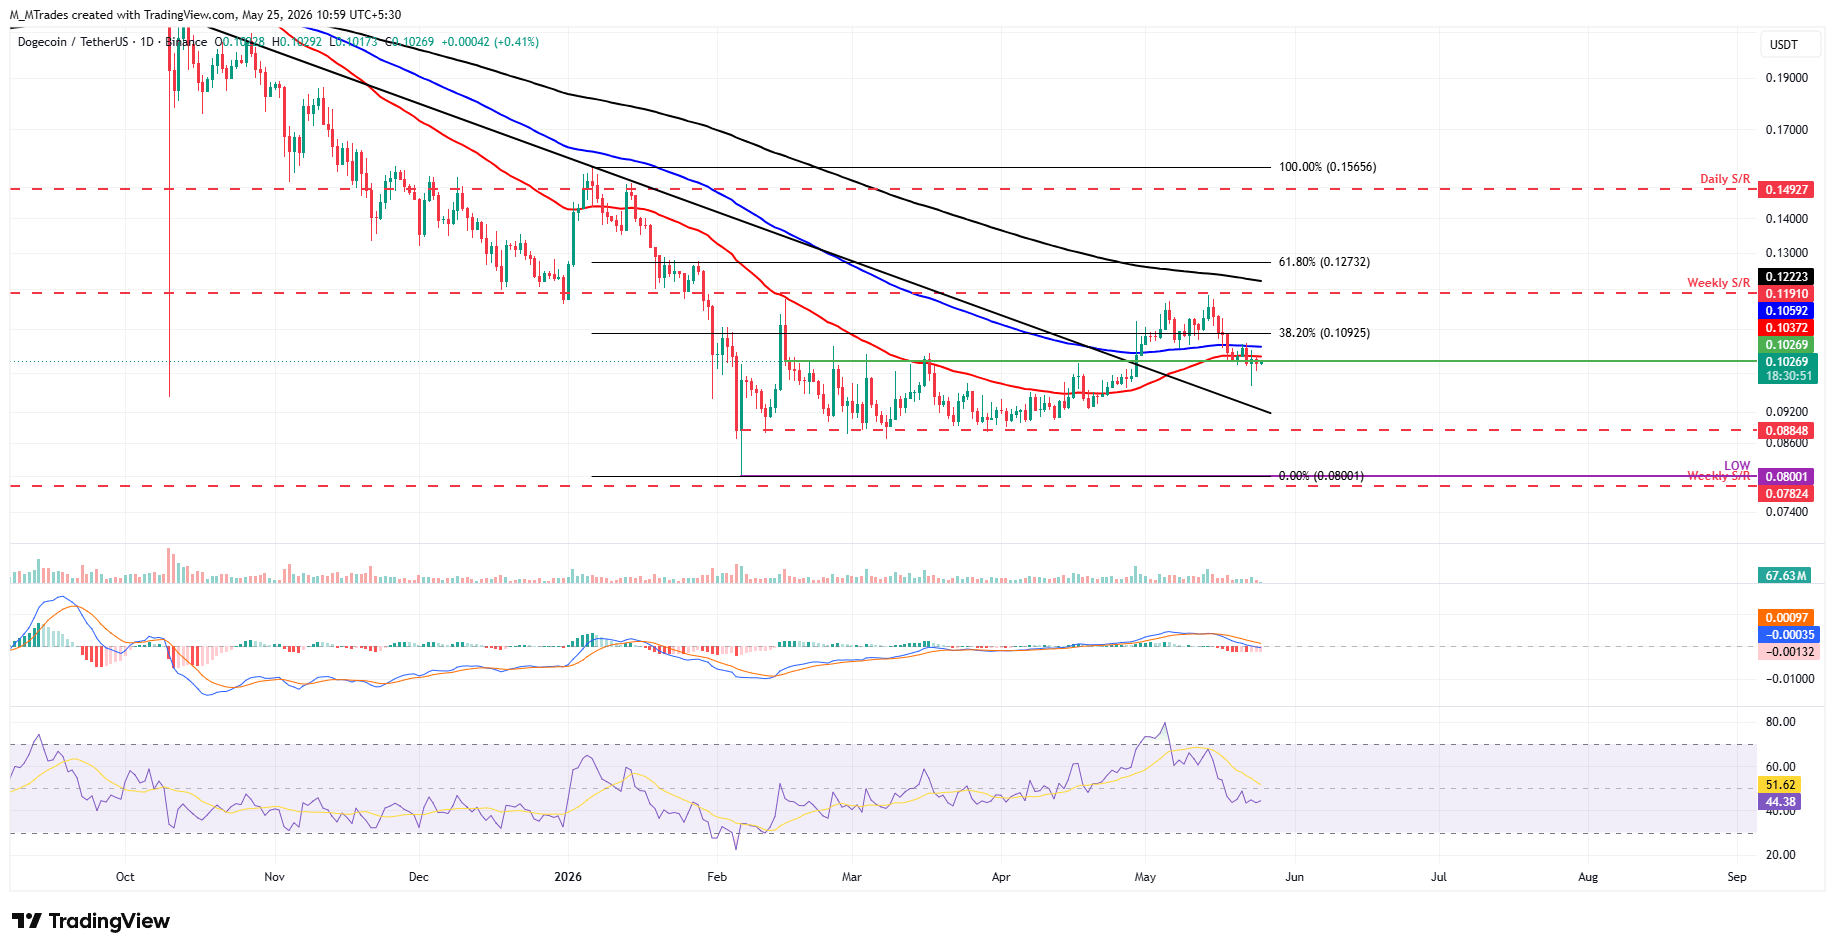
However, if DOGE recovers, it could extend the advance toward the 100-day EMA at $0.105.
Shiba Inu closes below the lower consolidation boundary
Shiba Inu corrected over 2% and closed below the lower boundary of the consolidation range at $0.0000056 in the previous week. At the time of writing on Monday, SHIB is retesting this previously broken zone.
If SHIB faces rejection at $0.0000056, it could extend losses toward the February 6 low at $0.0000050.
Like Dogecoin, SHIB’s momentum indicators, RSI and MACD, show bearish momentum gaining traction.
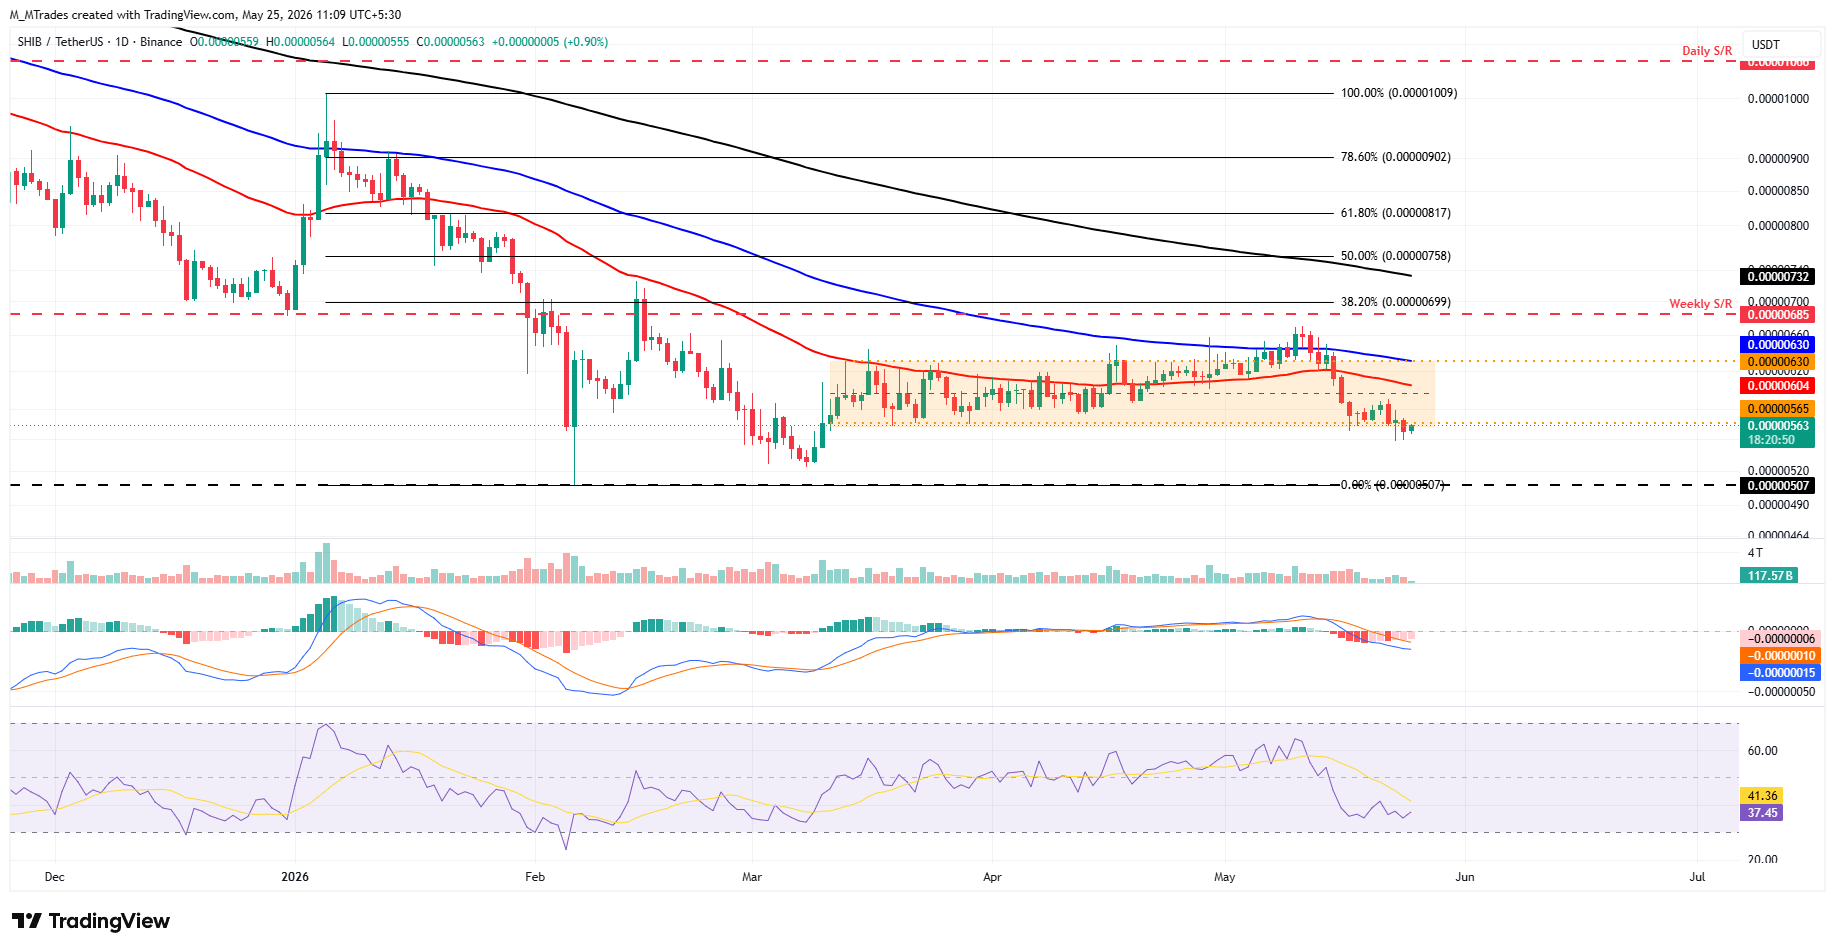
On the other hand, if SHIB recovers, it could extend the advance toward the 50-day EMA at $0.0000060.
Pepe could extend losses if it closes below key support
Pepe price corrected over 2.7% last week and retested the daily support at $0.0000036 on Monday.
If PEPE closes below the daily support at $0.0000036, it could extend the losses toward the April 7 low at $0.0000033.
Like Dogecoin and Shiba Inu, Pepe’s momentum indicators, RSI and MACD, also support a negative outlook.
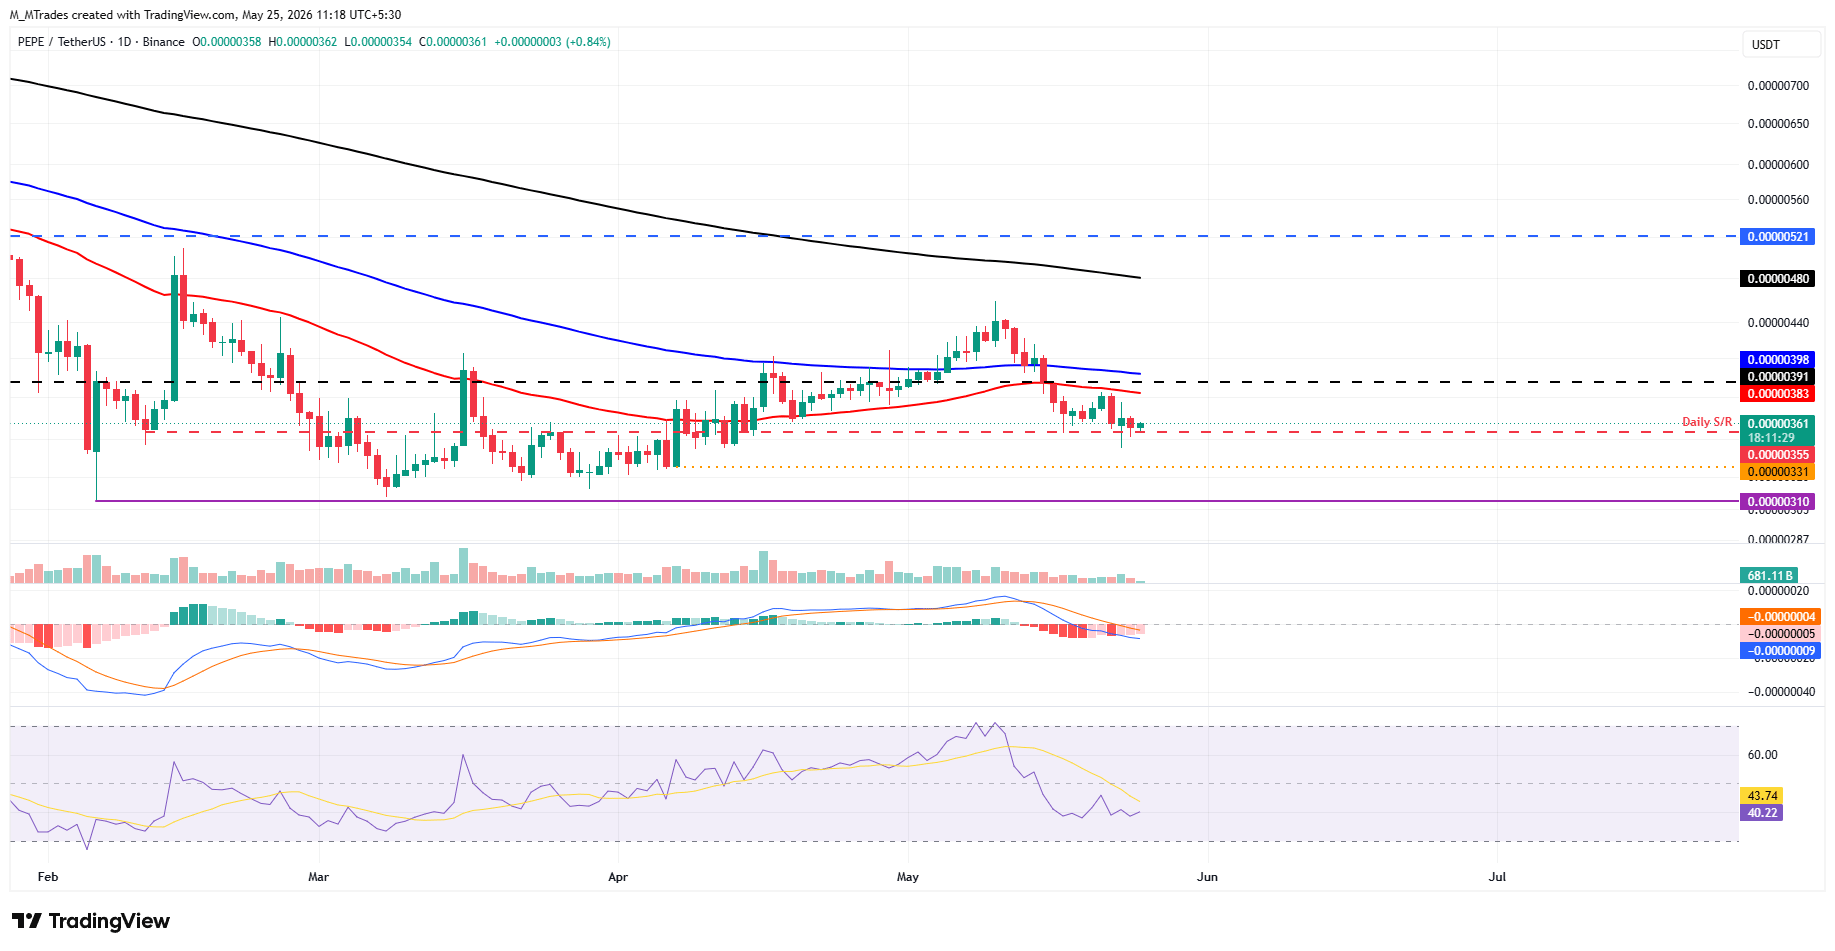
If PEPE recovers, it could extend the recovery toward the 50-day EMA at $0.0000038.
Recommended Articles








Comments (0)
Click the $ button, enter the symbol, and select to link a stock, ETF, or other ticker.