


Dash Price Forecast: Dash rally builds on regulatory scrutiny and Zcash integration hopes



- Dash is up 12% on Wednesday, extending a rebound above the $40 mark.
- The privacy coin is likely gaining traction ahead of the upcoming CLARITY Act vote and the integration of the Zcash Orchard shielded pool.
- Retail interest is leading to a positional buildup in DASH futures.
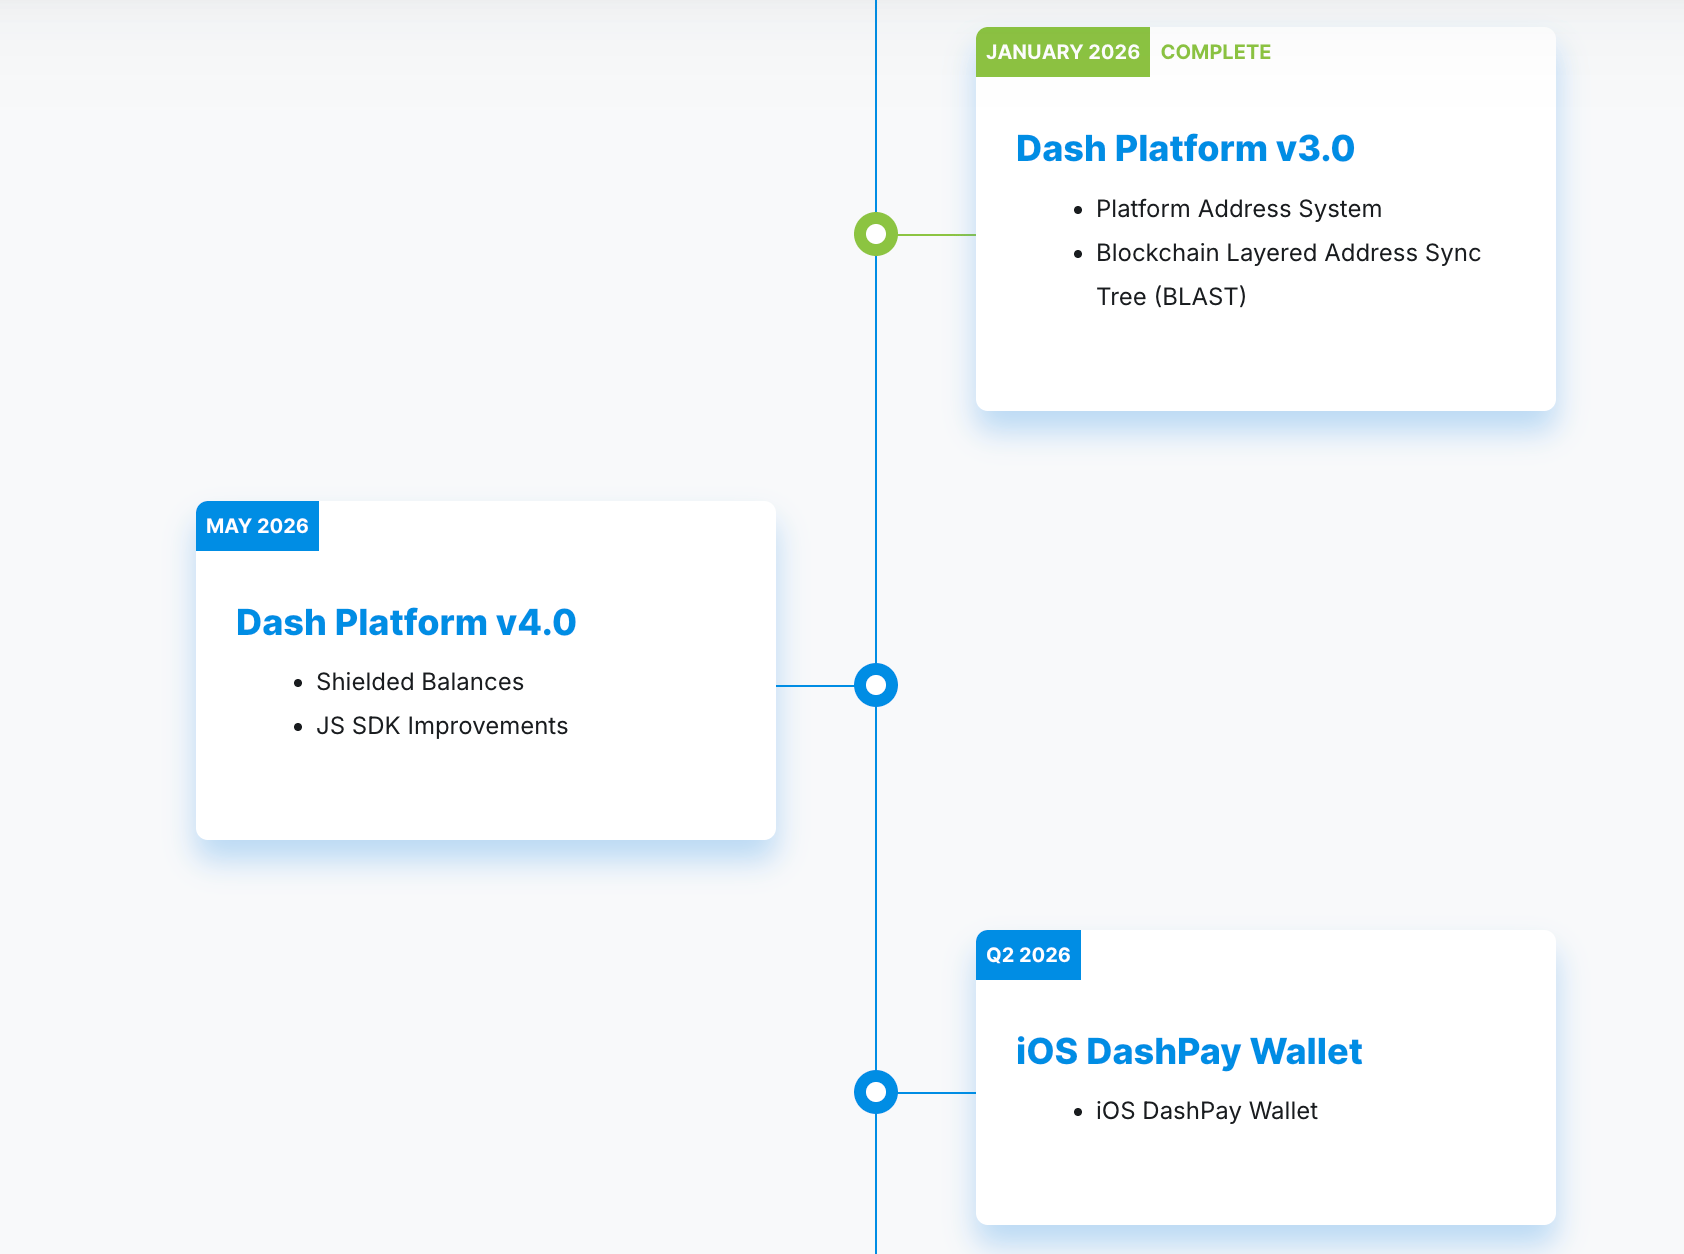
Dash (DASH) is up 12% on Wednesday, extending Monday’s 5% gain toward the $50 milestone. Retail interest is growing, driven by regulatory concerns over the upcoming Digital Assets Market Clarity Act (CLARITY) and the Zcash Orchard Shielded Pool integration, which enhances infrastructure flexibility.
Dash integrates the Zcash shielded pool to clear the CLARITY Act barrier
Dash announced the integration of Zcash Orchard Shielded Pool on February 19, which, according to its official roadmap, will be completed in May. The roadmap lacks an official date, but the retail anticipation is surging as the month comes to an end. The integration will rebrand Dash's infrastructure from the CoinJoin (mixing) method to the zk-SNARKs (shielded) method to potentially achieve compliance with the CLARITY Act, which fueled the recent Zcash rally earlier this month.
On the derivatives side, DASH futures Open Interest (OI) is up nearly 19% over the last 24 hours to $72.95 million, indicating a positional buildup driven by retail interest for leveraged exposure. The total liquidations of $185,120 in the same period were led by $64,100 in DASH long positions, indicating a bearish wipeout.
Typically, such decisive liquidations led to an imbalance in more active long positions, but the long-to-short ratio of 1.0016 reaffirms almost equal positions on both sides.

Will DASH cross above $50?
Dash trades around $47.10 at press time on Wednesday, extending a bullish bias as price holds above the 50-period Exponential Moving Average (EMA) on the 4-hour chart near $43.56 and the 200-period EMA around $41.85. The climb through the 23.6% and 38.2% Fibonacci Retracements at roughly $43.54 and $46.01, measured over the downswing from $58.09 to $39.84, reinforces a constructive structure.
The 50% retracement level at $48.10 serves as the immediate resistance, guarding the higher barriers at the 61.8% and 78.6% retracement levels at $50.29 and $53.58, respectively.
Momentum is growing bullish on the 4-hour chart, as the Relative Strength Index (RSI) above 71 suggests early overbought conditions, even as the Moving Average Convergence Divergence (MACD) extends a steady positive trend above its signal line, hinting that upside momentum could be stretched in the near term.
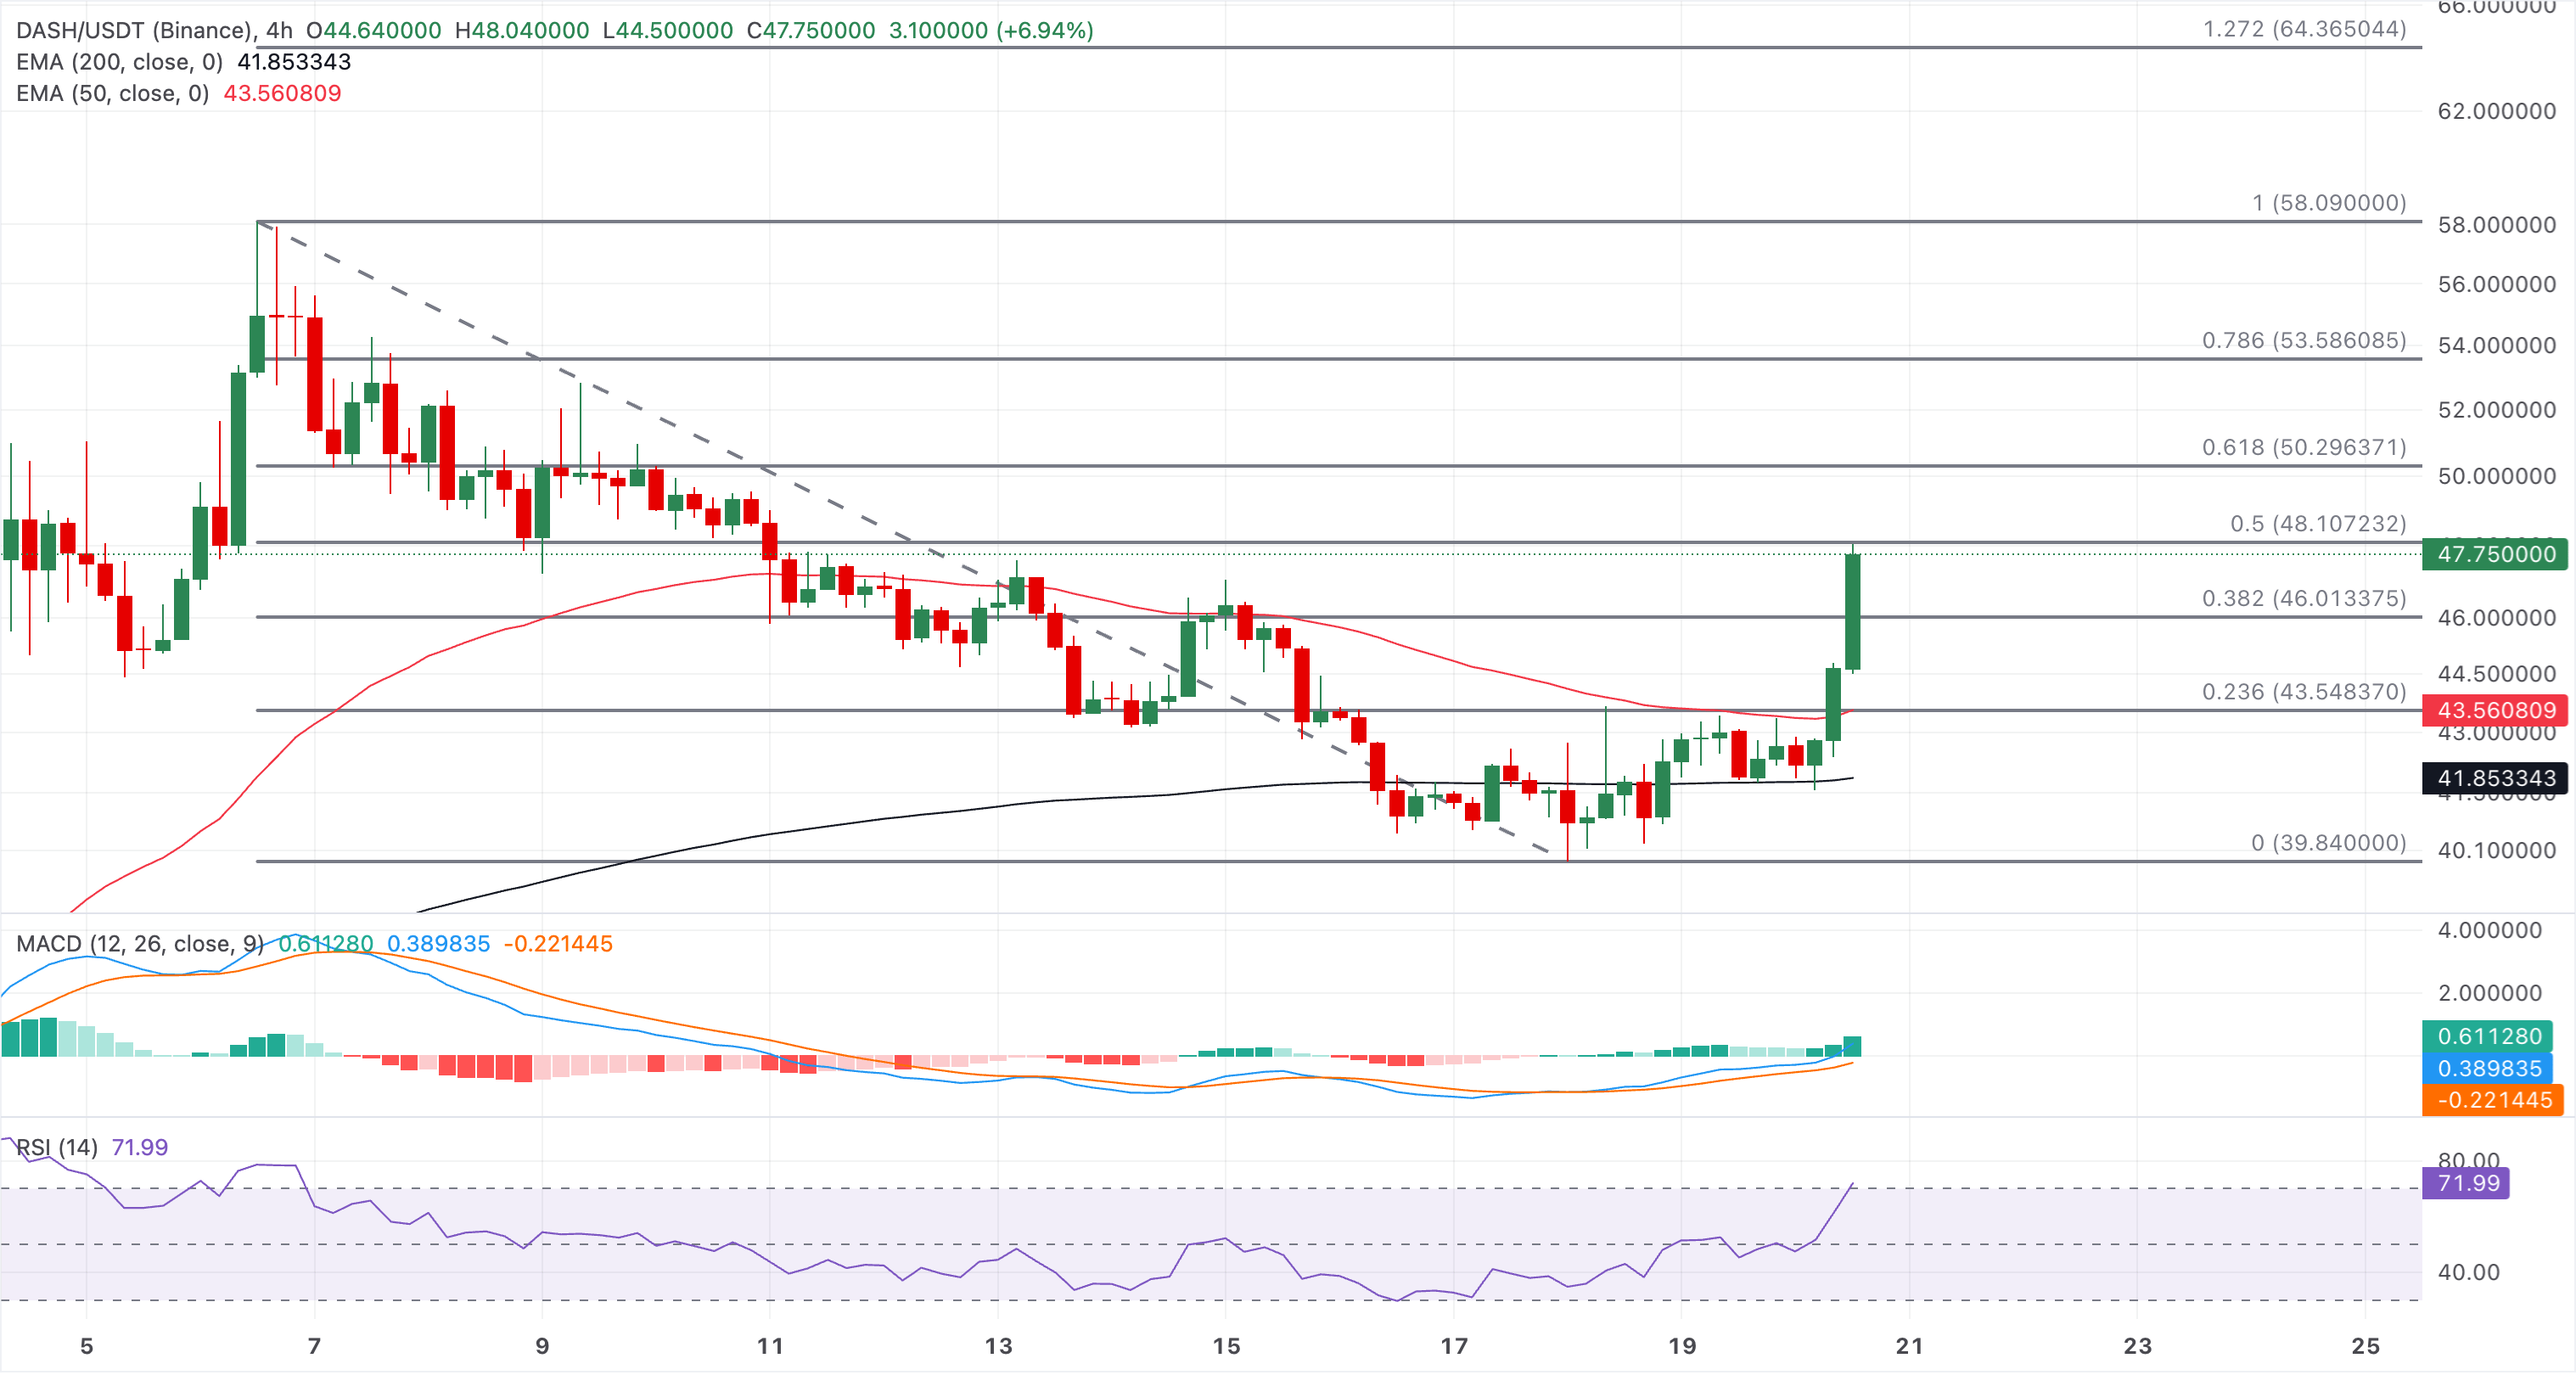
On the downside, initial support emerges at the 38.2% Fibonacci retracement around $46.01, ahead of the 23.6% level near $43.54, close to the EMA 50 at $43.56.
(The technical analysis of this story was written with the help of an AI tool.)
Recommended Articles








Comments (0)
Click the $ button, enter the symbol, and select to link a stock, ETF, or other ticker.