


Pi Network Price Forecast: PI extends bearish breakout as selling pressure grows



- Pi Network extends losses for the fourth consecutive day on Monday, approaching the $0.1500 mark.
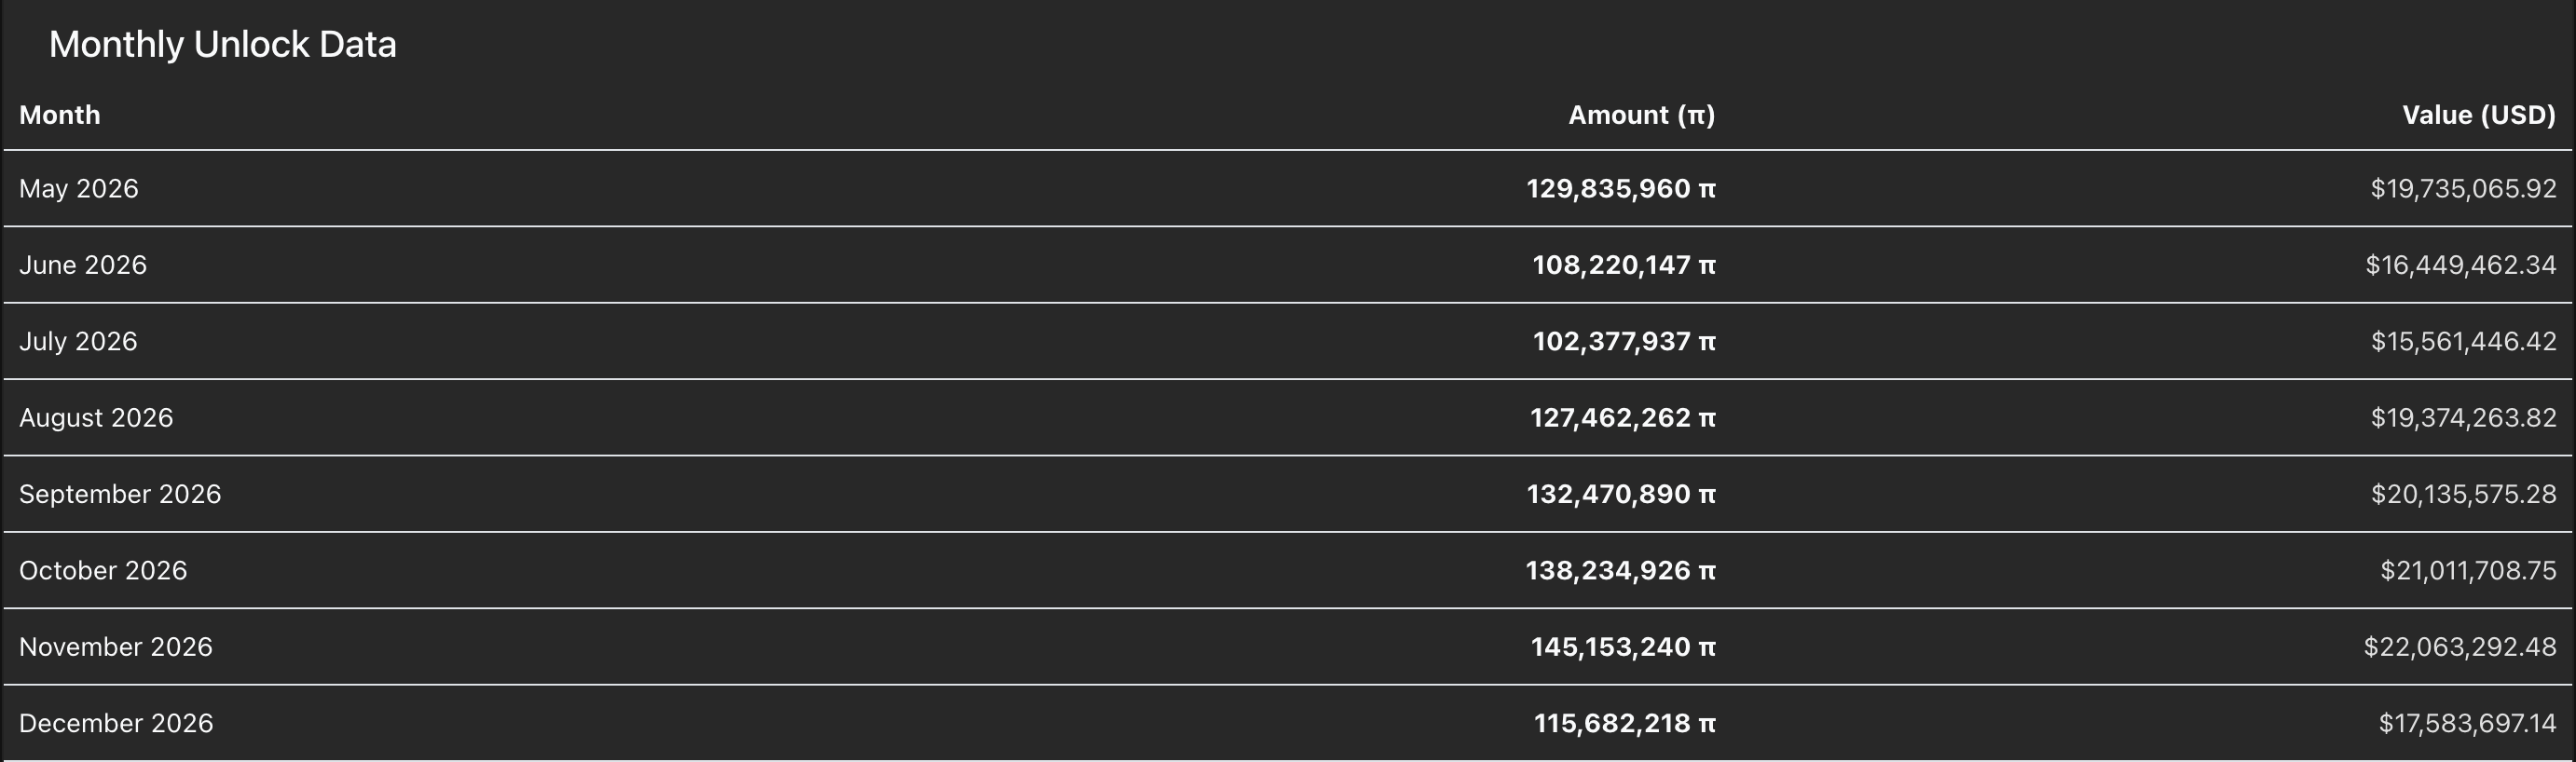
- PiScan data shows roughly 130 million PI tokens were unlocked in May, which could add to selling pressure.
- The technical outlook is bearish, with a risk of a pullback near its all-time low.
Pi Network (PI) edges below $0.1600 on Monday, recording its fourth straight day of losses. Sustained selling pressure, with roughly 130 million PI tokens remaining to be unlocked in May, could push Pi toward its all-time low at $0.1310.
Pi Network’s token unlock adds to downside risk
Pi Network monthly token unlocks are a consistent downside pressure weighing on short-term recovery runs. PiScan data shows that 129.83 million PI tokens will be unlocked in the rest of May, worth $19.73 million, which could add to selling pressure as falling prices erode holders' confidence.
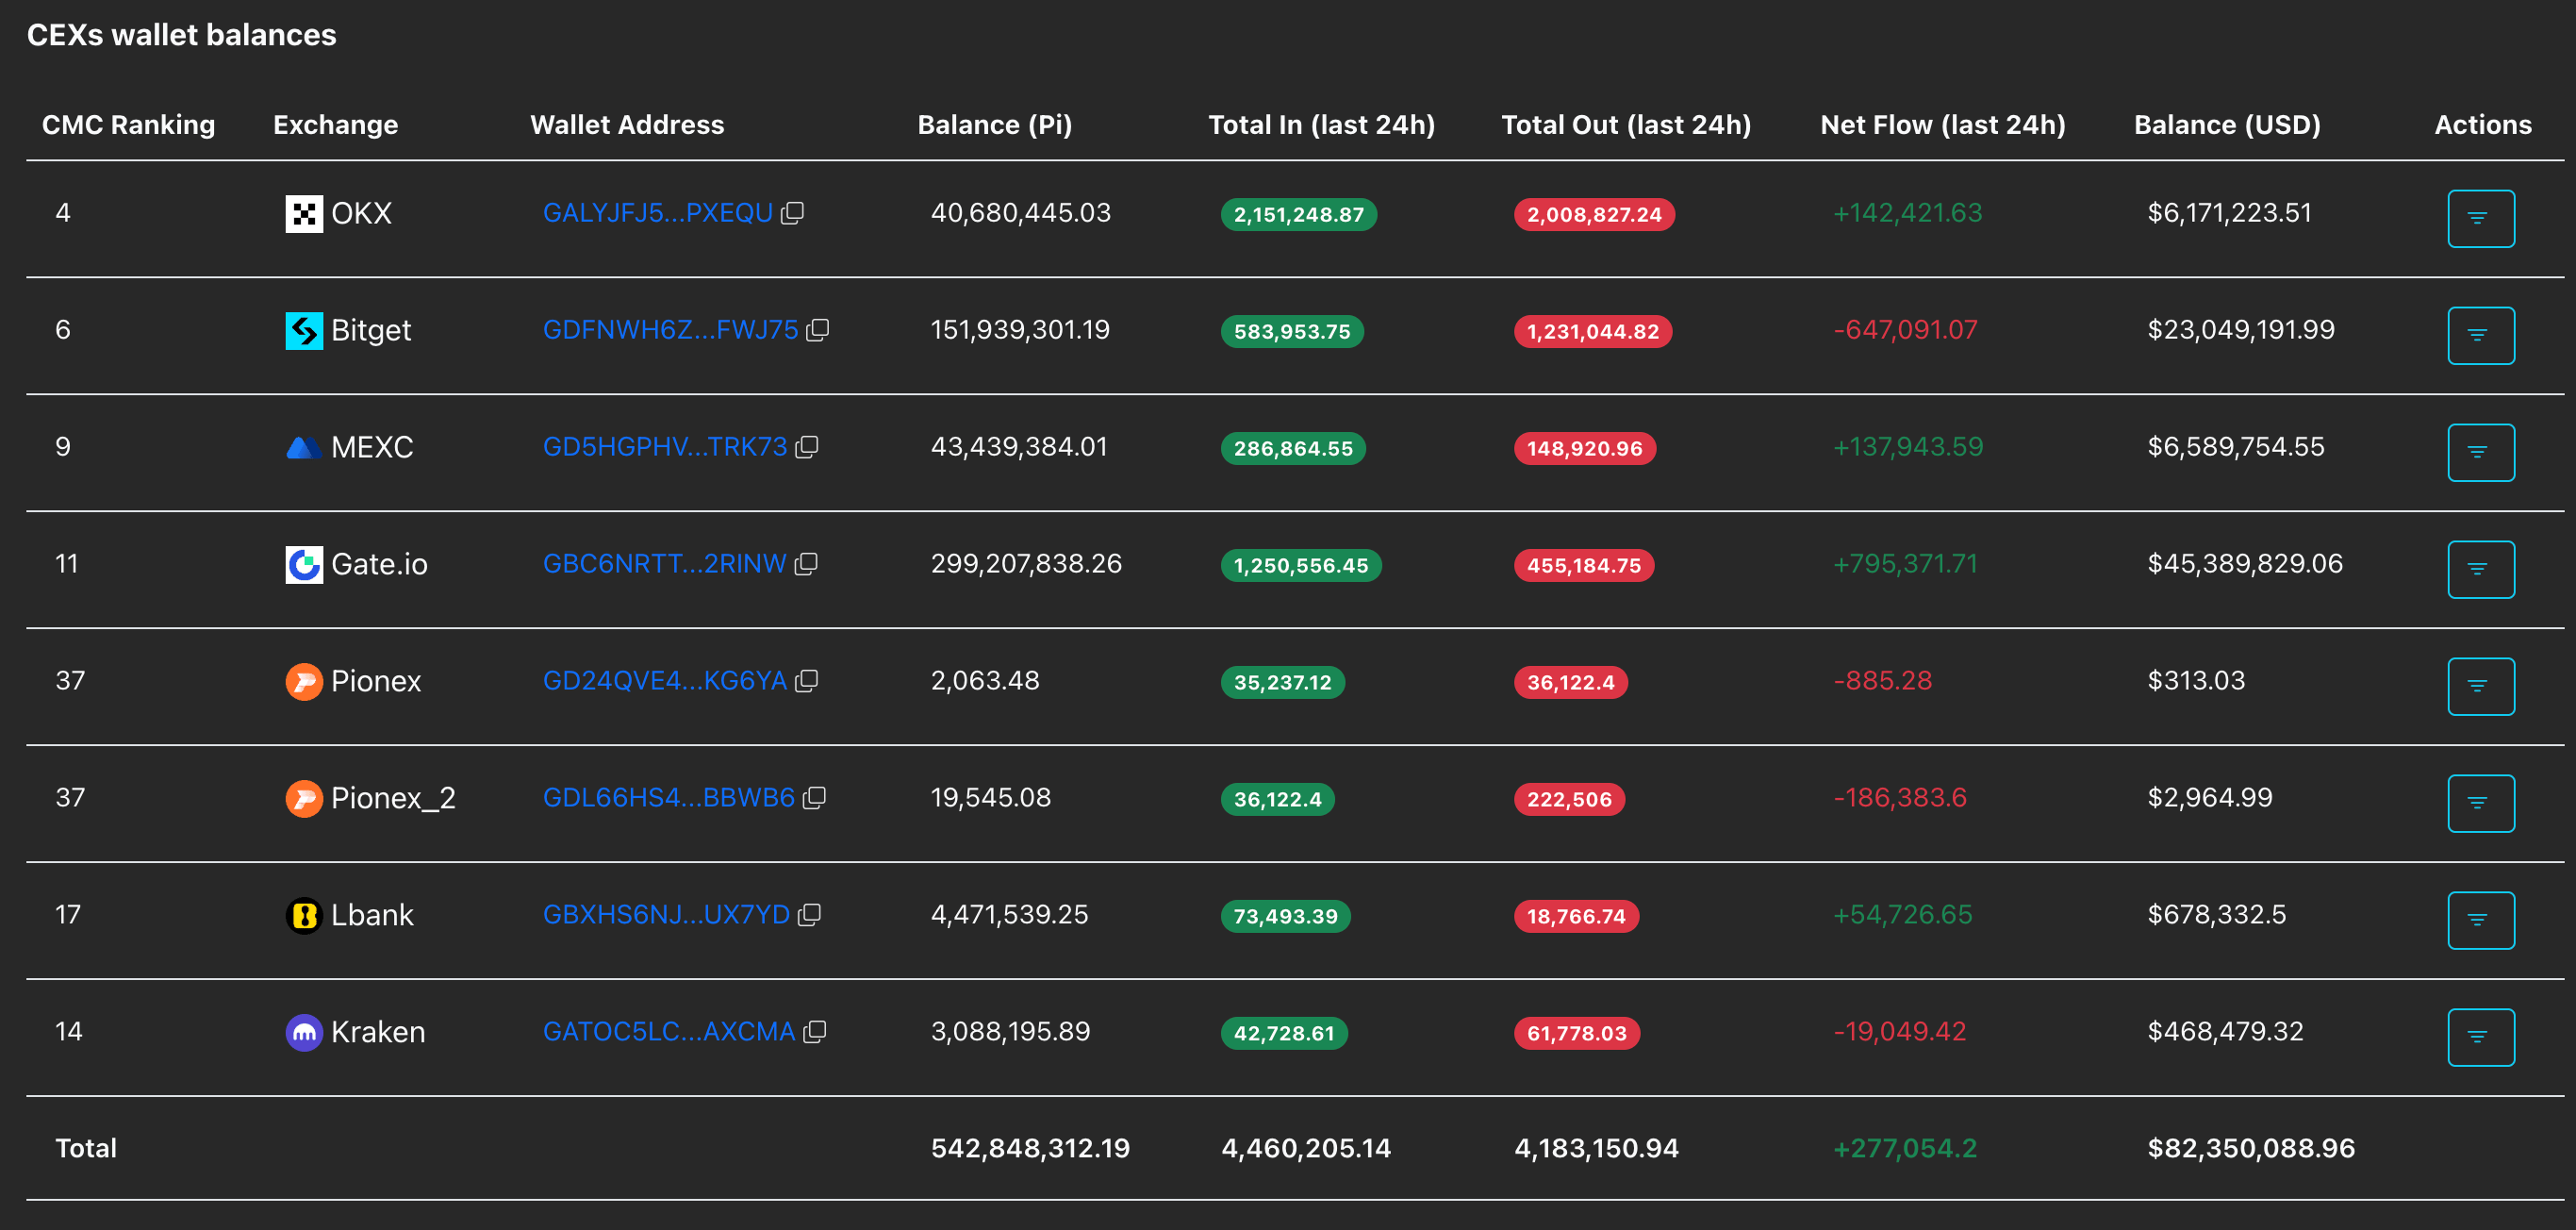
At the same time, the PI token reserve on Centralized Exchange (CEX) wallets recorded an inflow of over 277,000 tokens over the last 24 hours, bringing the total to roughly 543 million PI tokens, reaffirming the available supply pressure.
Technical outlook: Will Pi Network drop below $0.1500?
Pi Network edges lower on Monday, approaching the $0.1500 threshold. PI maintains a clear near-term bearish bias beneath the 50-period Exponential Moving Average (EMA) at $0.1669 on the 4-hour chart and the 200-period EMA at $0.1736.
The Relative Strength Index (RSI) on the same chart dips to 24, signaling oversold conditions that hint at stretched downside momentum rather than a confirmed reversal. The Moving Average Convergence Divergence (MACD) reinforces the bearish view, with the average lines and histogram bars deep in negative territory.
On the downside, the current zone near the S1 Pivot Point at $0.1521 acts as the first pivot area, with scope for further declines toward the S2 and S3 Pivot Points at $0.1440 and $0.1319, respectively.
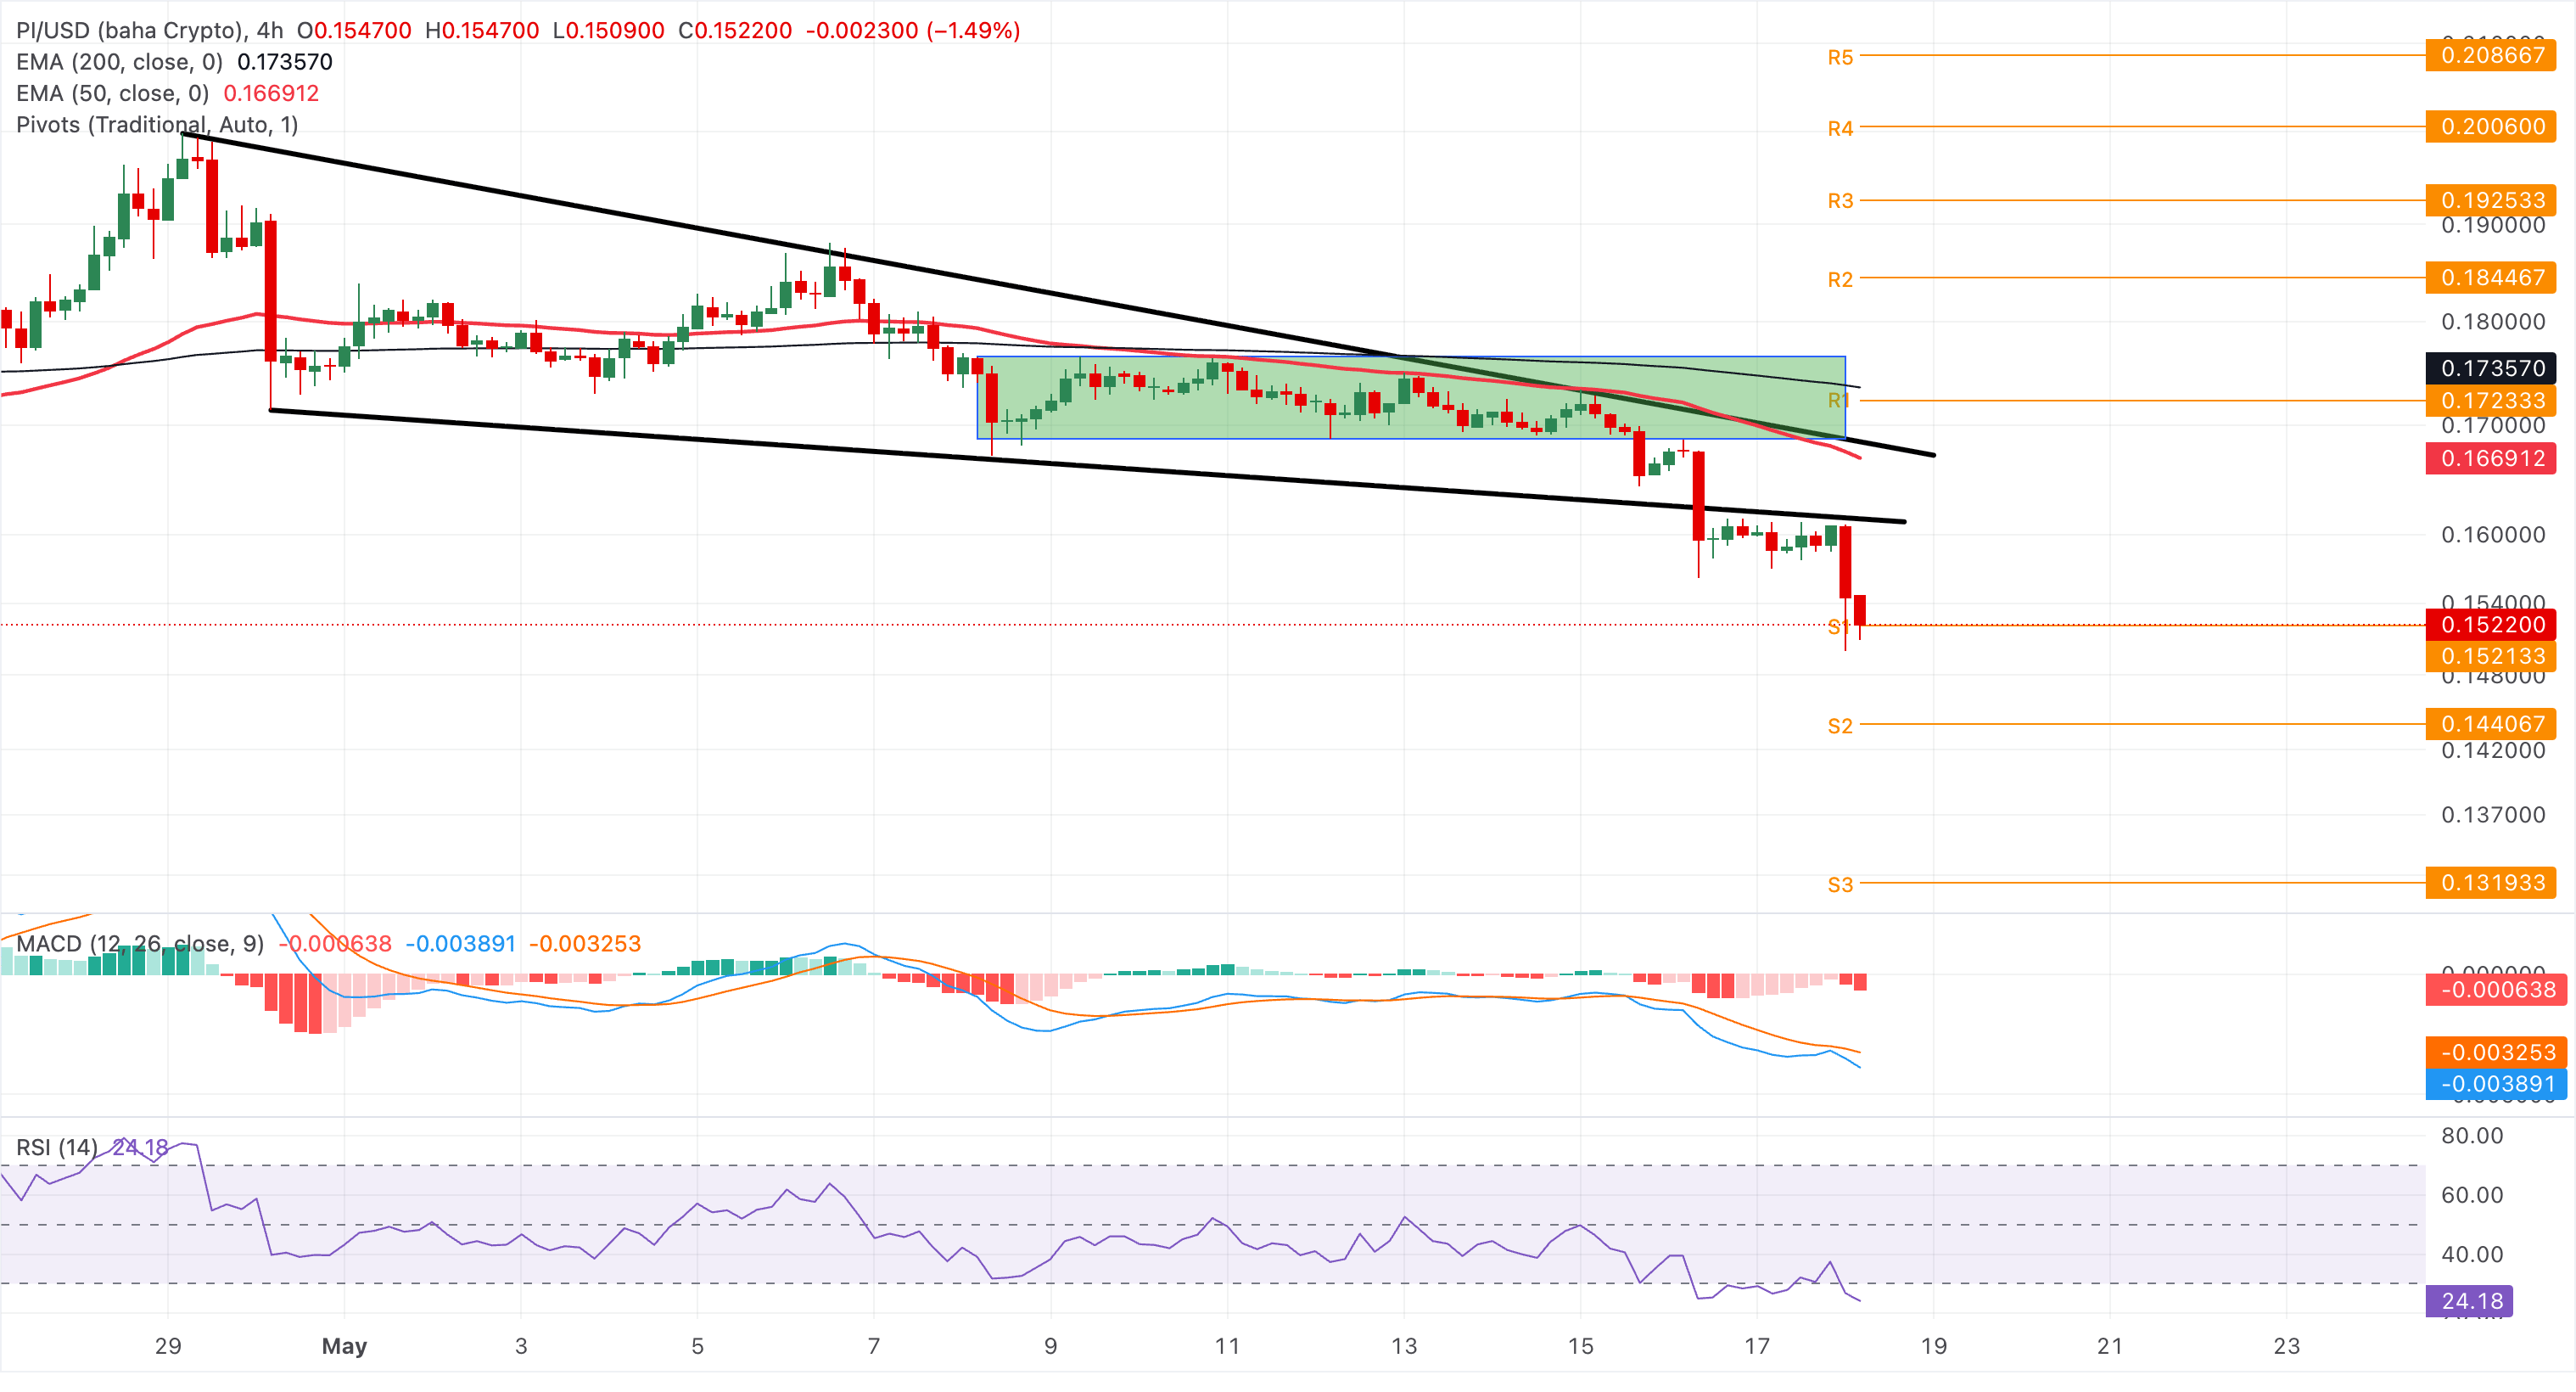
On the topside, initial resistance is seen at the longer-term descending trendline, now coming in near $0.1645, ahead of a tighter cap from the 50-period EMA at $0.1669.
(The technical analysis of this story was written with the help of an AI tool.)
Recommended Articles








Comments (0)
Click the $ button, enter the symbol, and select to link a stock, ETF, or other ticker.