


Zcash Price Forecast: ZEC rallies 68% in May driven by surging retail interest



- Zcash rises for the eighth consecutive day on Thursday and holds above the $570 short-term support level.
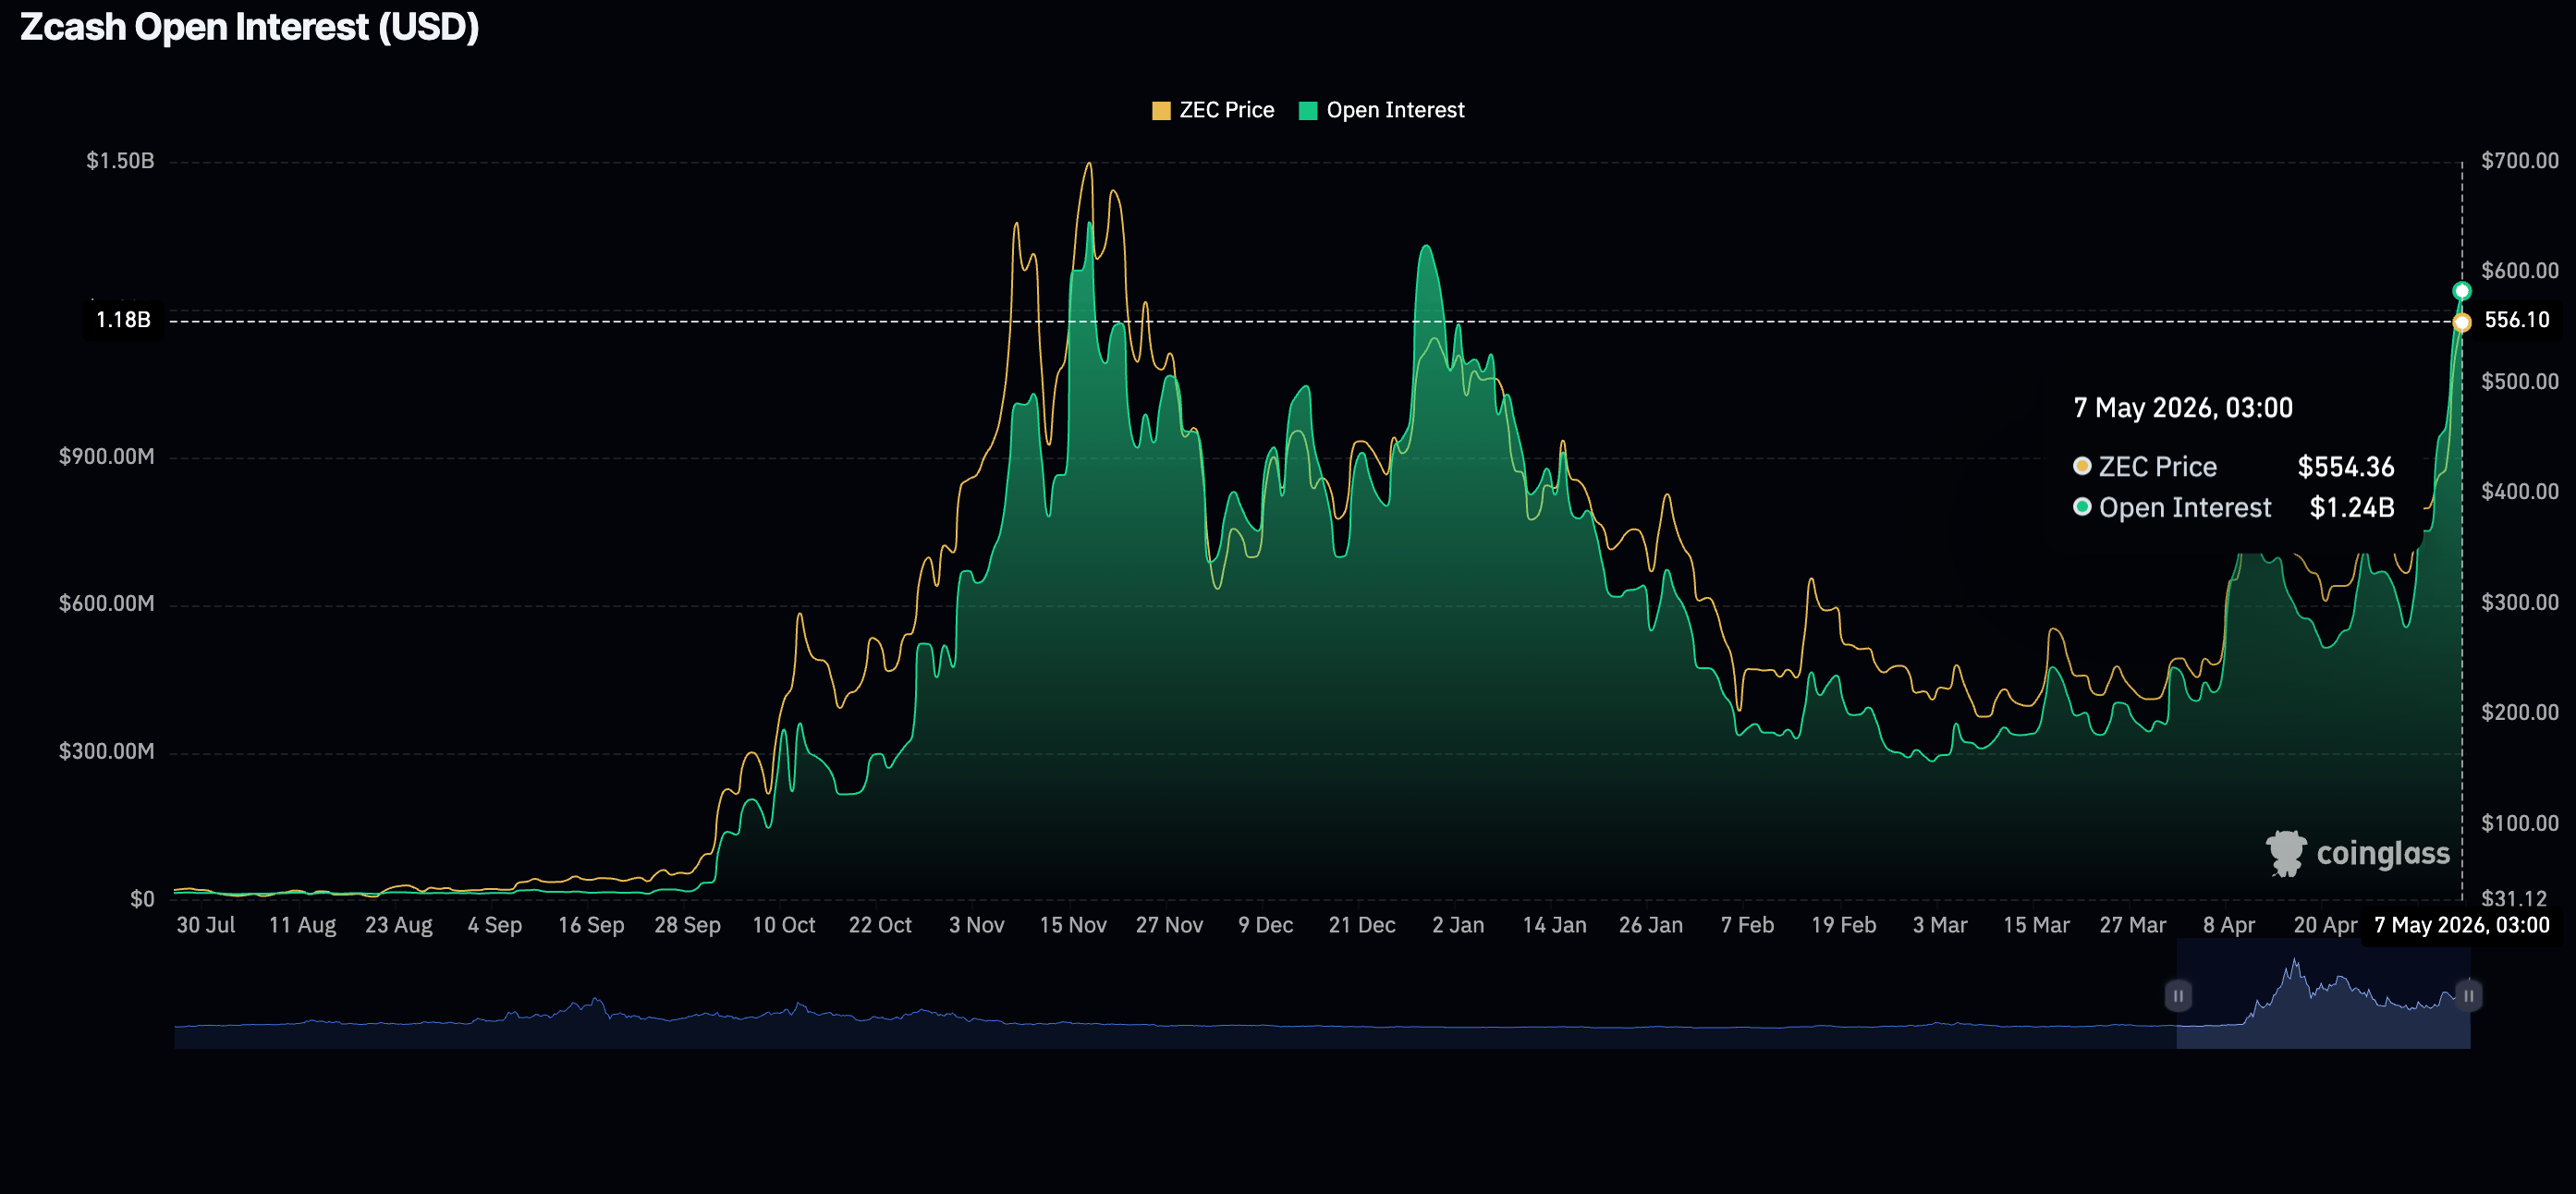
- ZEC attracts retail interest, with perpetual futures Open Interest rising to $1.24 billion for the first time in four months.
- Zcash momentum indicators strengthen the bullish narrative, with price action poised to test the $600 resistance level.
Zcash (ZEC) continues to build momentum, trading above $570 at the time of writing on Thursday. The privacy-oriented token has sustained significant gains since late April, rising from lows of $345, supported by steady retail demand.
Sustained gains could push ZEC toward the psychological $600 threshold, bringing the price closer to the record high of $750 reached in November.
Zcash bullish outlook improves on rising retail demand
Zcash is attracting immense retail interest, with perpetual futures Open Interest rising alongside the price to hit $1.24 billion on Thursday, up from $1.16 billion the previous day. This is the highest level the OI has reached since late December.
The simultaneous surge in price and OI suggests that traders are aggressively increasing risk exposure and opening new long positions. Sustained OI growth would suggest growing market conviction and expanding speculative interest.
Despite the bullish outlook, investors should remain cautiously optimistic amid the overhanging leverage risk that could trigger a long squeeze. Should ZEC fail to break key resistance, highly leveraged positions risk liquidation, adding to the selling pressure. Moreover, there is the risk of profit-taking, which may weigh on the token.
Technical outlook: Zcash bulls maintain market leadership
Zcash trades at $577, extending a robust bullish phase after decisively reclaiming and accelerating away from its key Exponential Moving Averages (EMAs). The 50-day EMA at $346, the 100-day EMA at $324 and the 200-day EMA at $300 now trail well below spot, suggesting a firmly established uptrend with price stretched to the upside.
Momentum aligns with the bullish view, as the Relative Strength Index (RSI) hovers at 86 in overbought territory on the daily chart. Moreover, the Moving Average Convergence Divergence (MACD) histogram remains firmly positive, suggesting buyers still dominate in the near term despite the risk of a cooling.
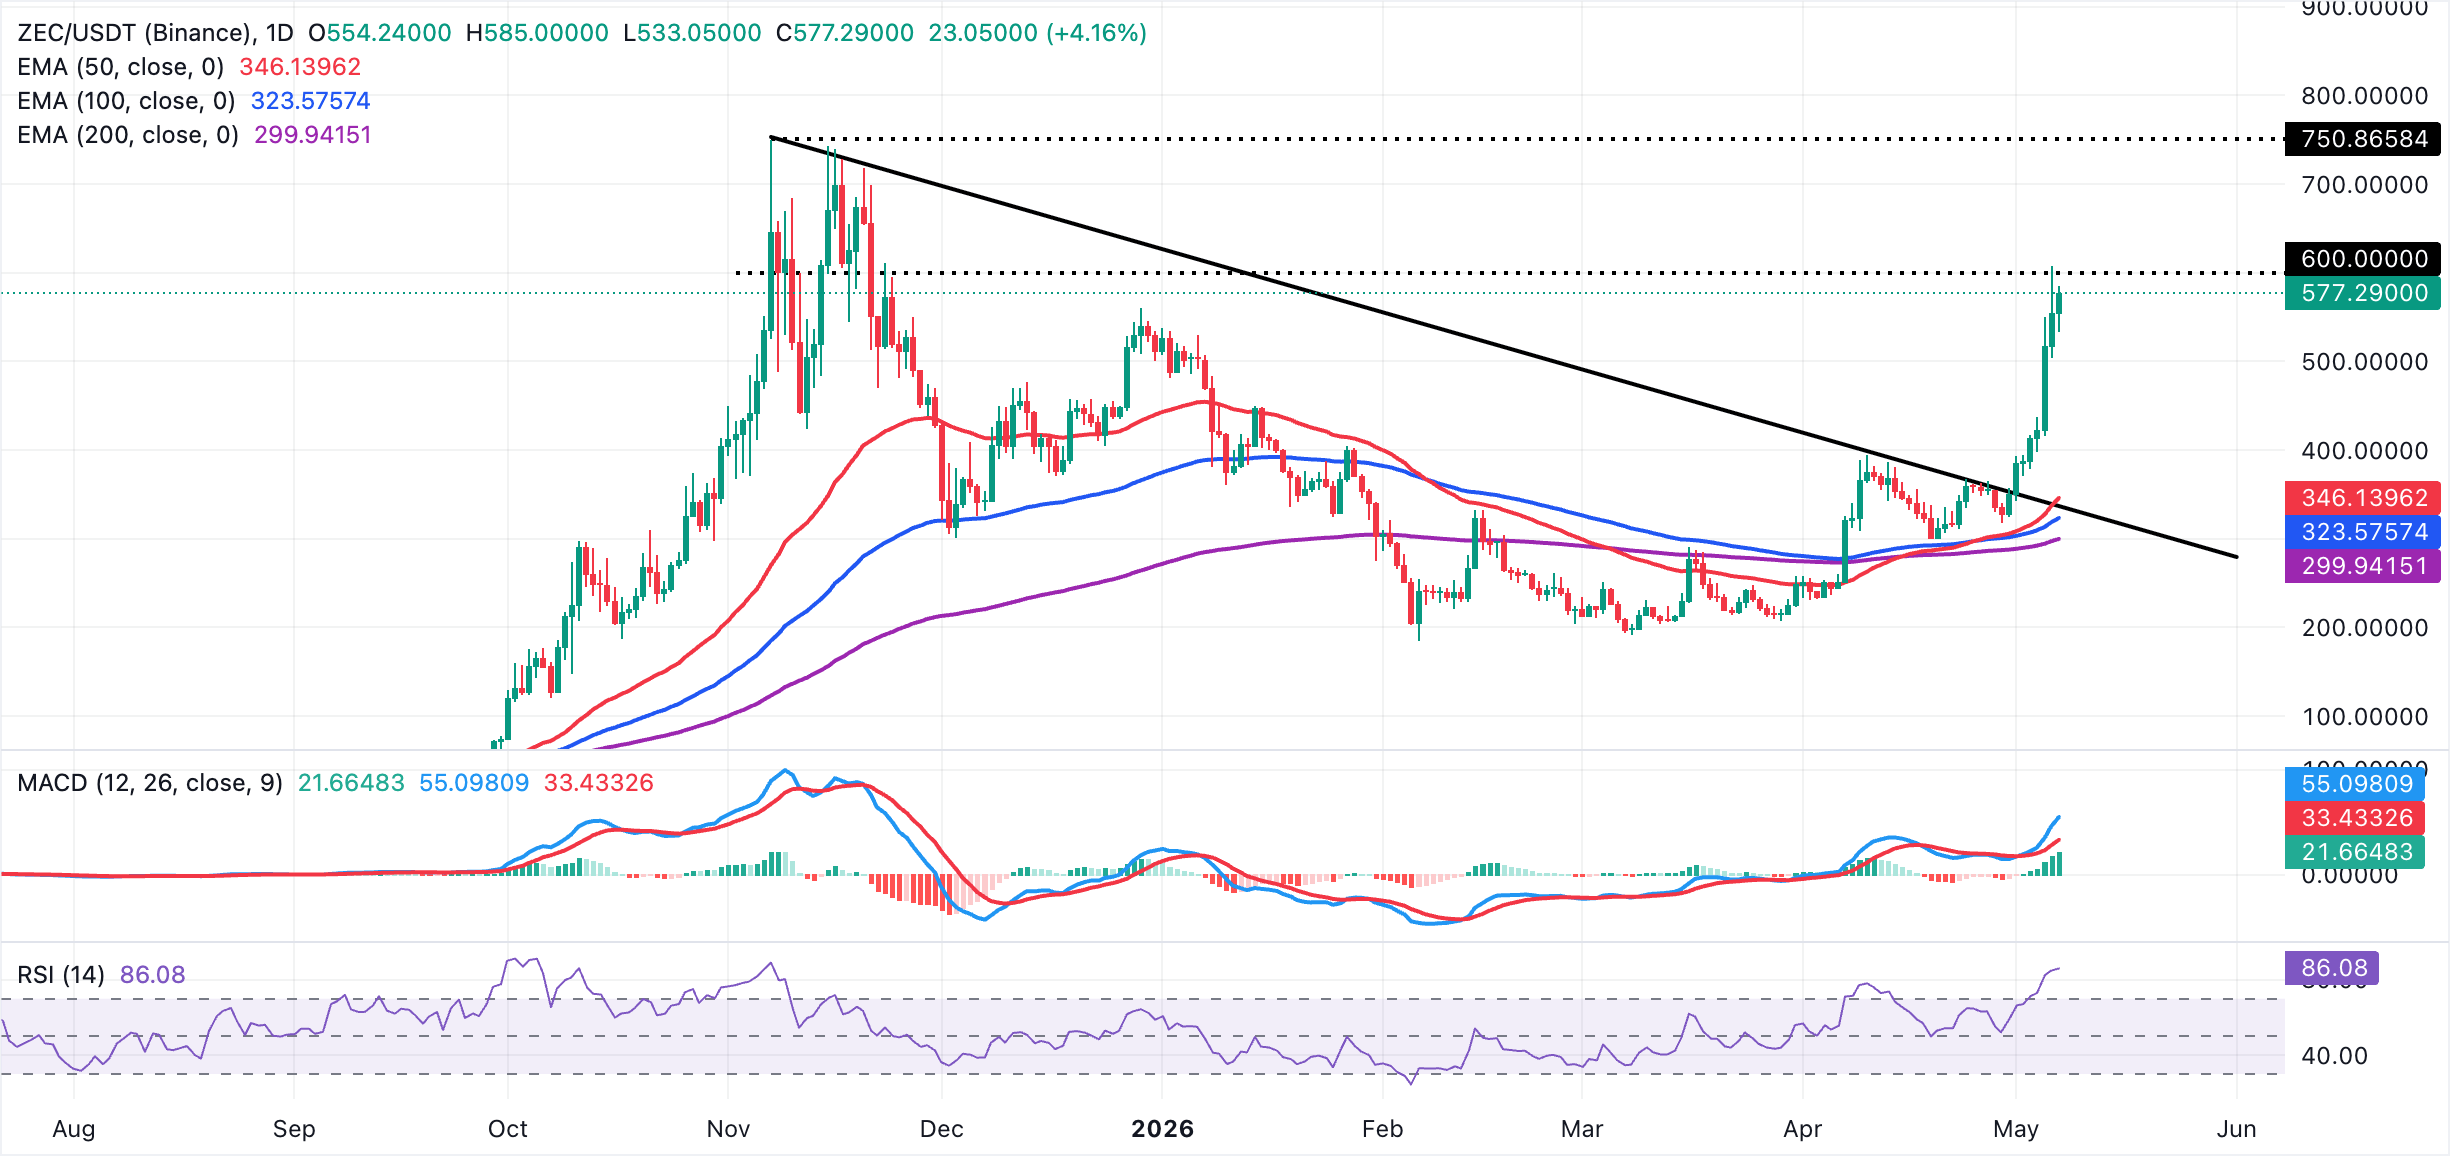
On the downside, immediate support lies at $570, with a deeper corrective pullback likely to encounter demand at $500, followed by the 50-day EMA at $346 and the former downward resistance trendline, now a structural floor near $336. Below these, the 100-day EMA at $324 and the 200-day EMA at $300 reinforce a demand band that underpins the broader bullish structure. On the upside, further advances would encounter resistance at $600, which stopped the rally on Wednesday ahead of the record high at $750.
(The technical analysis of this story was written with the help of an AI tool.)
Open Interest, funding rate FAQs
Higher Open Interest is associated with higher liquidity and new capital inflow to the market. This is considered the equivalent of increase in efficiency and the ongoing trend continues. When Open Interest decreases, it is considered a sign of liquidation in the market, investors are leaving and the overall demand for an asset is on a decline, fueling a bearish sentiment among investors.
Funding fees bridge the difference between spot prices and prices of futures contracts of an asset by increasing liquidation risks faced by traders. A consistently high and positive funding rate implies there is a bullish sentiment among market participants and there is an expectation of a price hike. A consistently negative funding rate for an asset implies a bearish sentiment, indicating that traders expect the cryptocurrency’s price to fall and a bearish trend reversal is likely to occur.
Recommended Articles








Comments (0)
Click the $ button, enter the symbol, and select to link a stock, ETF, or other ticker.