


Pi Network Price Forecast: Contracting momentum flags downside risk despite retail interest surge



- Pi Network holds above $0.1800 on Thursday, clinging to its 50-day EMA support at $0.1786.
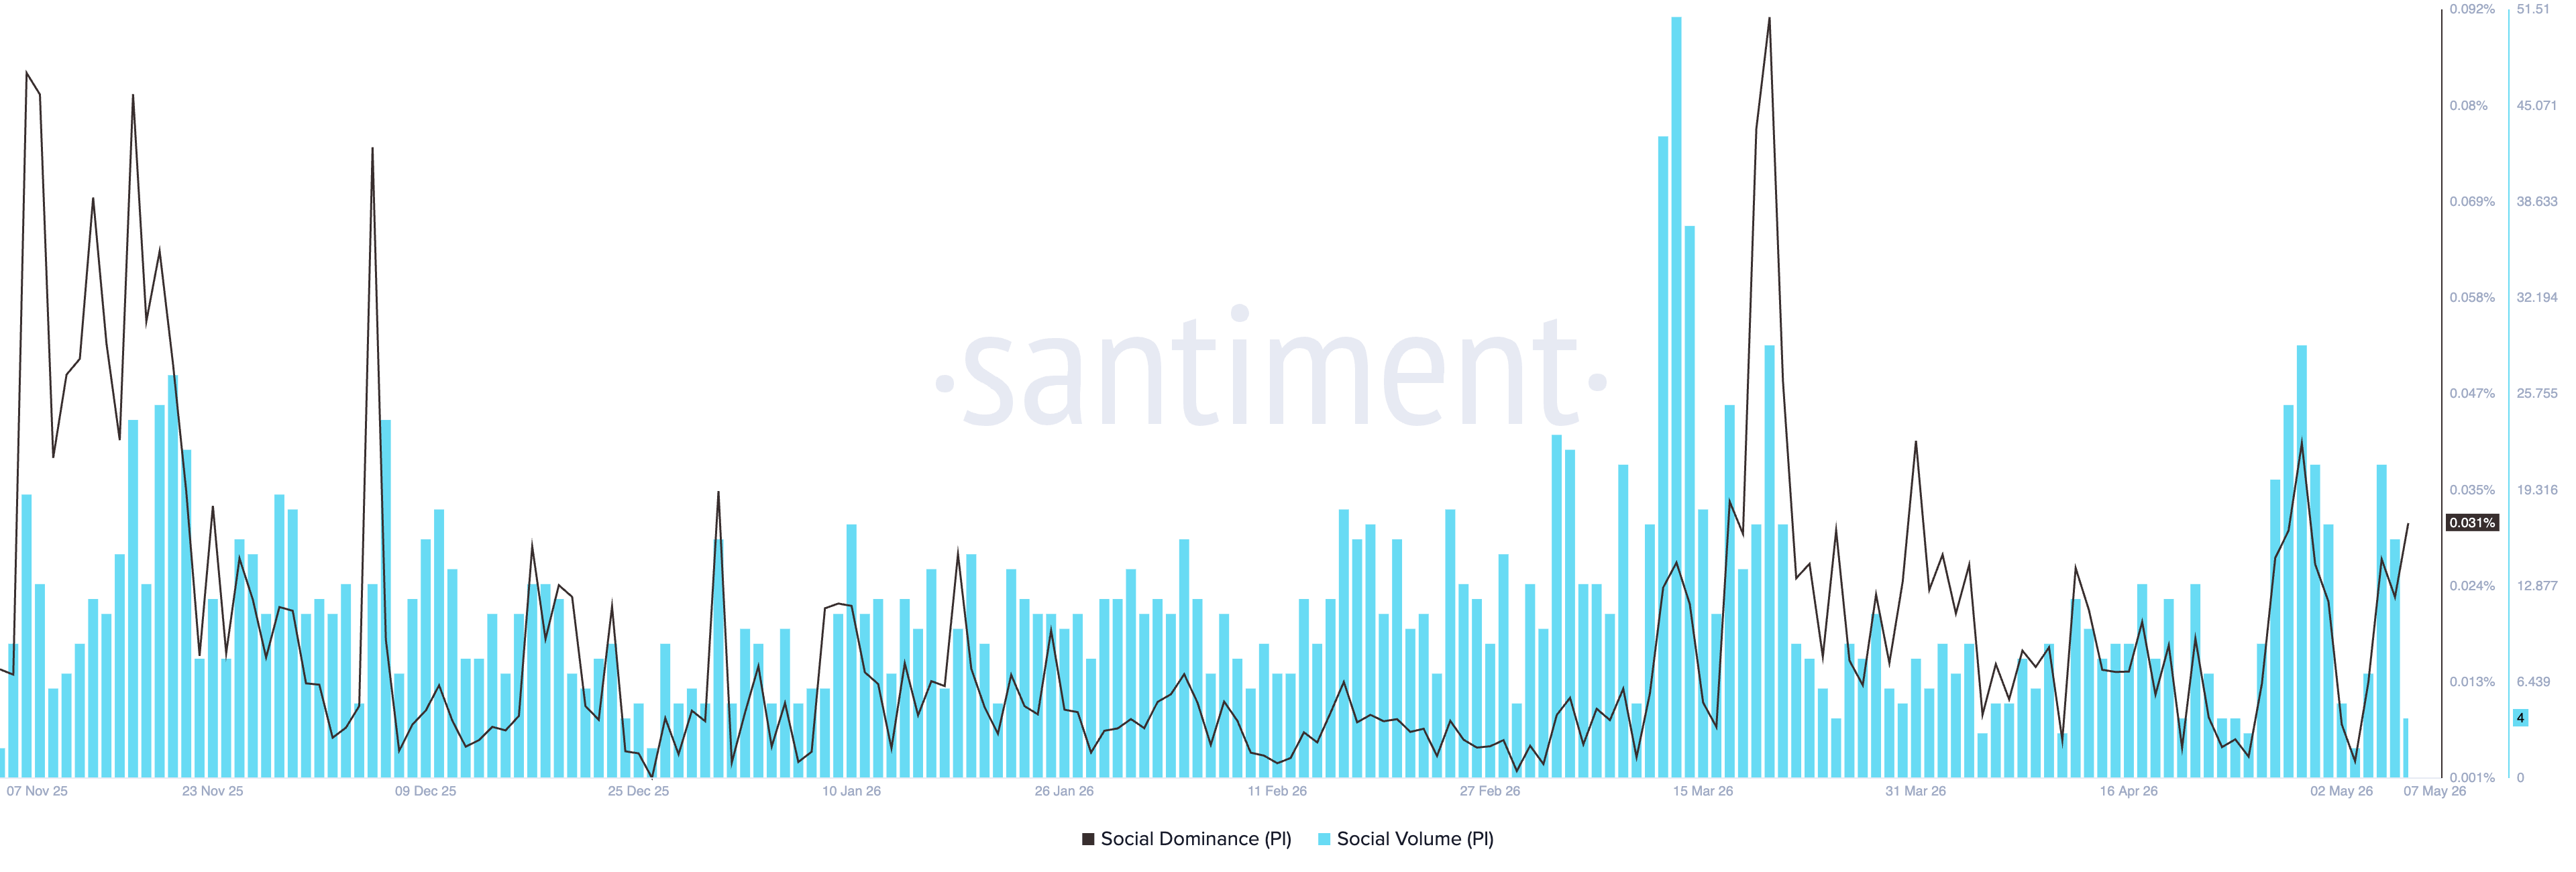
- PI token’s social dominance rebounds, reflecting increased retail interest likely driven by Dr. Chengdiao Fan’s talk at Consensus 2026.
- The technical outlook for PI is mixed as the price contracts within a triangle pattern, approaching a potential breakout.
Pi Network (PI) trades above $0.1800 at press time on Thursday, as momentum contracts despite a rise in social buzz, linked to its co-founder Dr. Chengdiao Fan’s talk at the Consensus 2026 on Wednesday.
Fan’s speech at Consensus boosts social interest in PI token
Pi Network’s co-founder Dr. Chengdiao Fan delivered a talk on “Aligning Web3, AI, and Blockchain for Utility.” Fan highlighted blockchain’s infrastructure, Know Your Customer (KYC) identity verification, and a globally engaged network as supporting utility-driven products and businesses in the AI era. At its core, Fan focused on "real users, real participation, and the human input at scale."

Santiment data shows the social dominance of the PI token has increased to 0.031%, up from 0.022% the previous day, signaling a boost in retail buzz as its co-founder enters the limelight.
Technical outlook: Could Pi Network rebound from its 50-day EMA?
Pi Network trades at $0.1802 at press time on Thursday, maintaining a capped tone as it holds below the 100-day and 200-day Exponential Moving Averages (EMAs) at roughly $0.1849 and $0.2387. The PI token is clinging just above the 50-day EMA at $0.1787 and an ascending support trendline near $0.1748, suggesting dip-buying interest persists. However, the broader structure remains constrained beneath the descending resistance line, which comes in around $0.1881.
The Relative Strength Index (RSI) at 51 on the daily chart maintains a neutral tone while the Moving Average Convergence Divergence (MACD) risks crossing below its signal line, hinting at waning bullish momentum.
On the topside, initial resistance is at the 100-day EMA around $0.1849, with the descending trendline barrier aligning at about $0.1881. A daily close above this zone would be needed to ease the current downside bias and open the way toward the $0.2000 psychological threshold, followed by the distant 200-day EMA near $0.2387.
On the downside, immediate support lies at the 50-day EMA at $0.1787, followed by the rising trendline floor near $0.1748, where a break lower would likely expose the pair to a deeper retracement within the broader bearish structure.
(The technical analysis of this story was written with the help of an AI tool.)
Recommended Articles








Comments (0)
Click the $ button, enter the symbol, and select to link a stock, ETF, or other ticker.