


Bitcoin Cash Price Forecast: BCH rallies on bullish derivatives signals



- Bitcoin Cash price extends gains on Wednesday, up over 8% so far this week.
- Derivatives data supports a bullish bias, with increasing open interest and long positions hitting a one-month high.
- The technical outlook suggests rally continuation, with bulls targeting levels above $500.
Bitcoin Cash (BCH) extends gains, trading above $485 on Wednesday, up over 8% so far this week. Bullish sentiment across the derivatives market is strengthening, fueling this ongoing rally in BCH.
In addition, overall market sentiment provides a supportive backdrop with Bitcoin (BTC) hovering near $82,000, while the technical outlook for BCH suggests further upside, with bulls targeting levels above $500.
Bullish derivatives traders lift sentiment
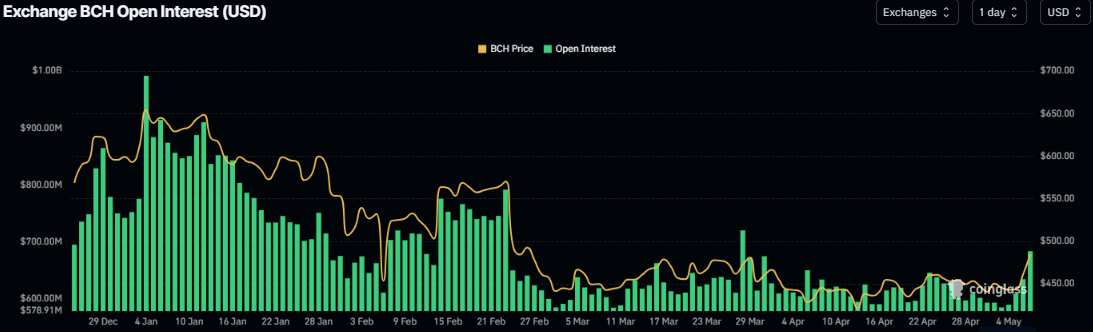
CoinGlass data shows that futures’ OI at exchanges in Bitcoin Cash surges to $683.83 million on Wednesday from $585 million on Sunday. An increasing OI indicates new or additional money entering the market and new buying, which could fuel a rally in BCH's price.
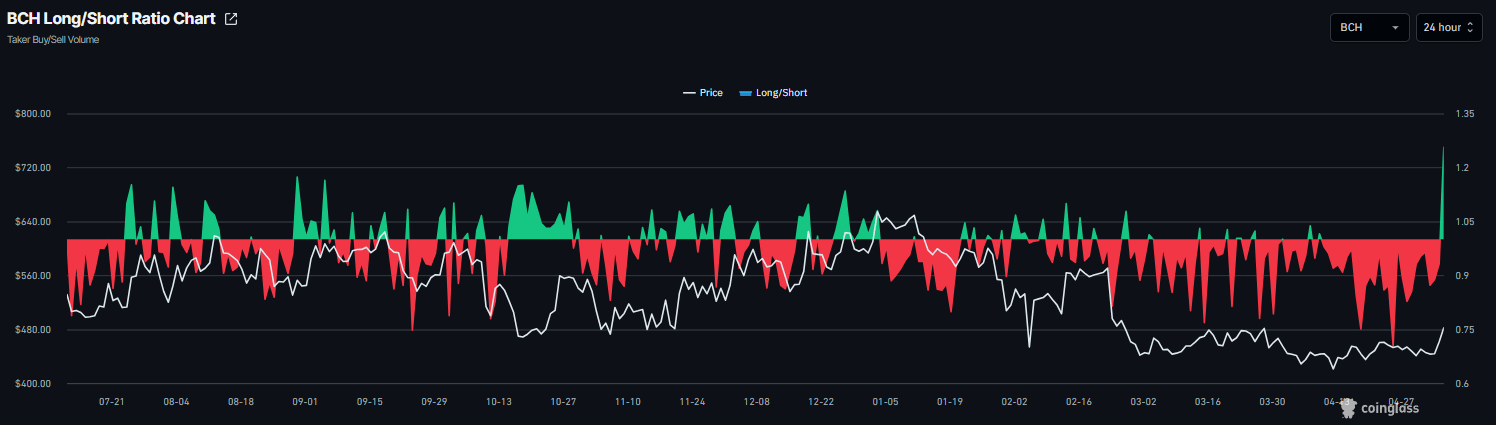
CoinGlass’ long-to-short ratio for BCH reads 1.25 on Wednesday, the highest level over a month. This ratio, being above one, reflects bullish sentiment in the market, as more traders are betting on the asset’s price to rally.
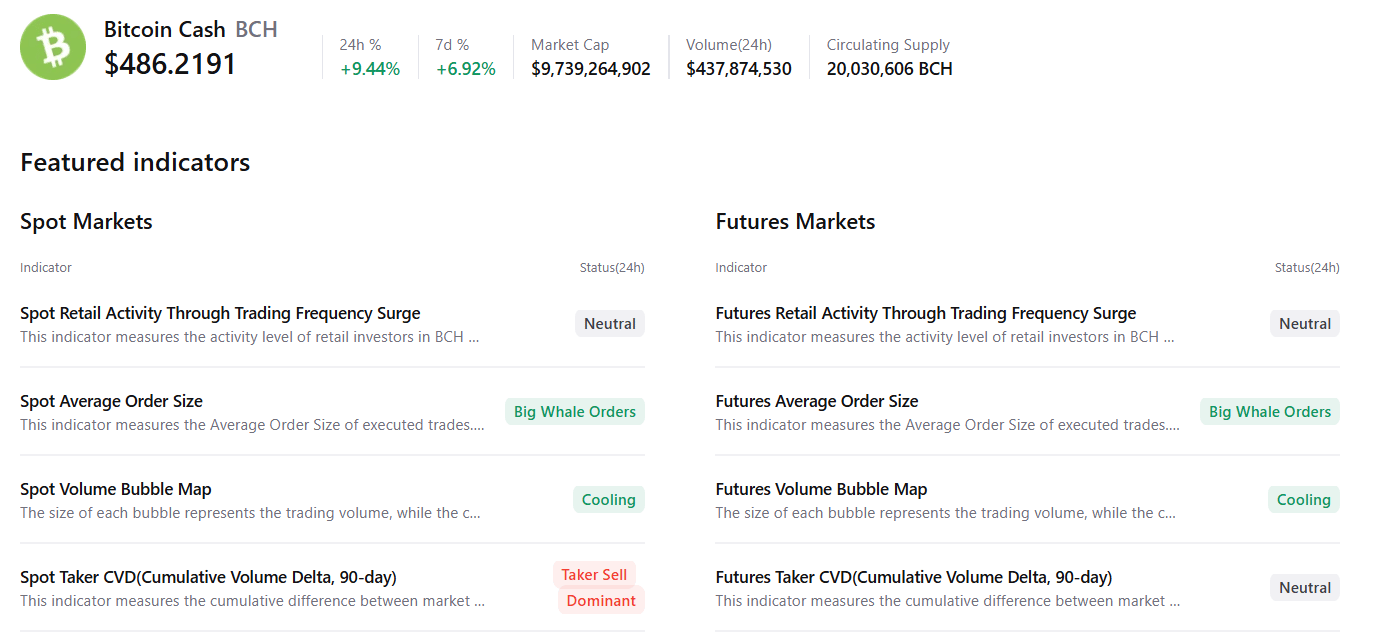
In addition, CryptoQuant summary data suggests a mixed, largely bullish outlook for Bitcoin Cash. BCH’s spot and futures markets show large whale orders alongside cooling conditions, suggesting a potential upside move. However, sell-side dominance in the spot market caps BCH’s upside.
Bitcoin Cash Price Forecast: Bulls aiming above the $500 mark
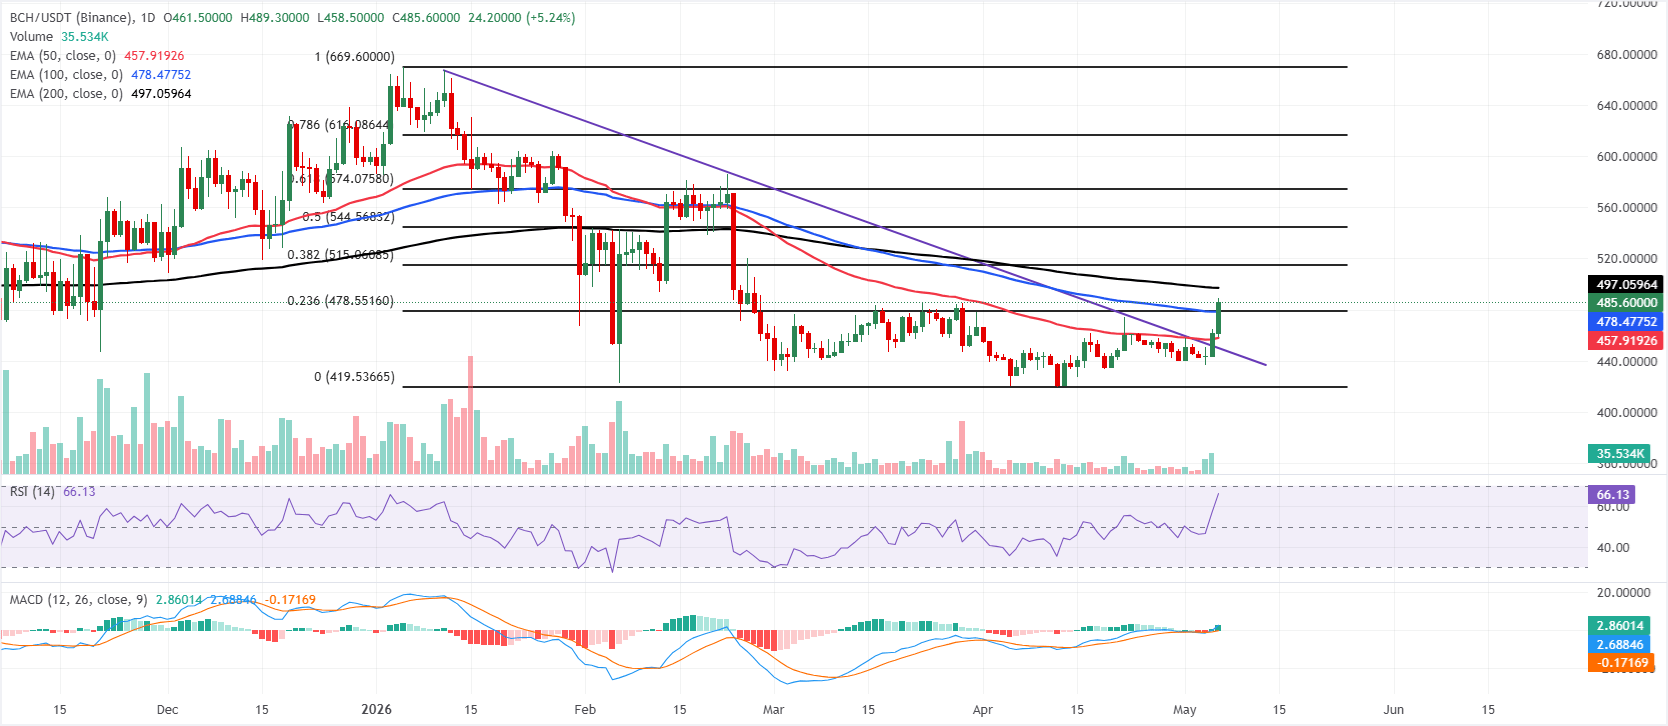
Bitcoin Cash price is trading at $485.60 on Wednesday, up over 8% so far this week. BCH has extended its advance above the medium-term Exponential Moving Averages (EMAs), with the 50-day EMA at $457.91 and the 100-day EMA at $478.47 now underpinning a constructive bias after the recent trendline break around $449.56.
Momentum tools back the bullish tone, as the Relative Strength Index (RSI) on the daily chart has climbed toward overbought territory near 66, while Moving Average Convergence Divergence (MACD) holds in positive territory and continues to expand, hinting that buying pressure is still in control despite stretched conditions.
On the topside, immediate resistance emerges at the 200-day EMA near $497.05; a daily close above this barrier would expose the 38.2% Fibonacci retracement of the broader downswing at $515.06, with further objectives at the 50% retracement around $544.56 and the 61.8% level near $574.07.
On the downside, initial support is seen in the $478.47–$478.55 area, where the 23.6% Fibonacci retracement converges with the 100-day EMA, ahead of the 50-day EMA at $457.91; a deeper pullback toward the former trendline break region around $449.56 would likely attract dip-buying while the broader floor at $419.53 holds.
(The technical analysis of this story was written with the help of an AI tool.)
Recommended Articles









Comments (0)
Click the $ button, enter the symbol, and select to link a stock, ETF, or other ticker.