


Pi Network Price Forecast: PI under pressure as heavy deposits threaten key support



- Pi Network is down 7% so far on Thursday, erasing the short-term gains.
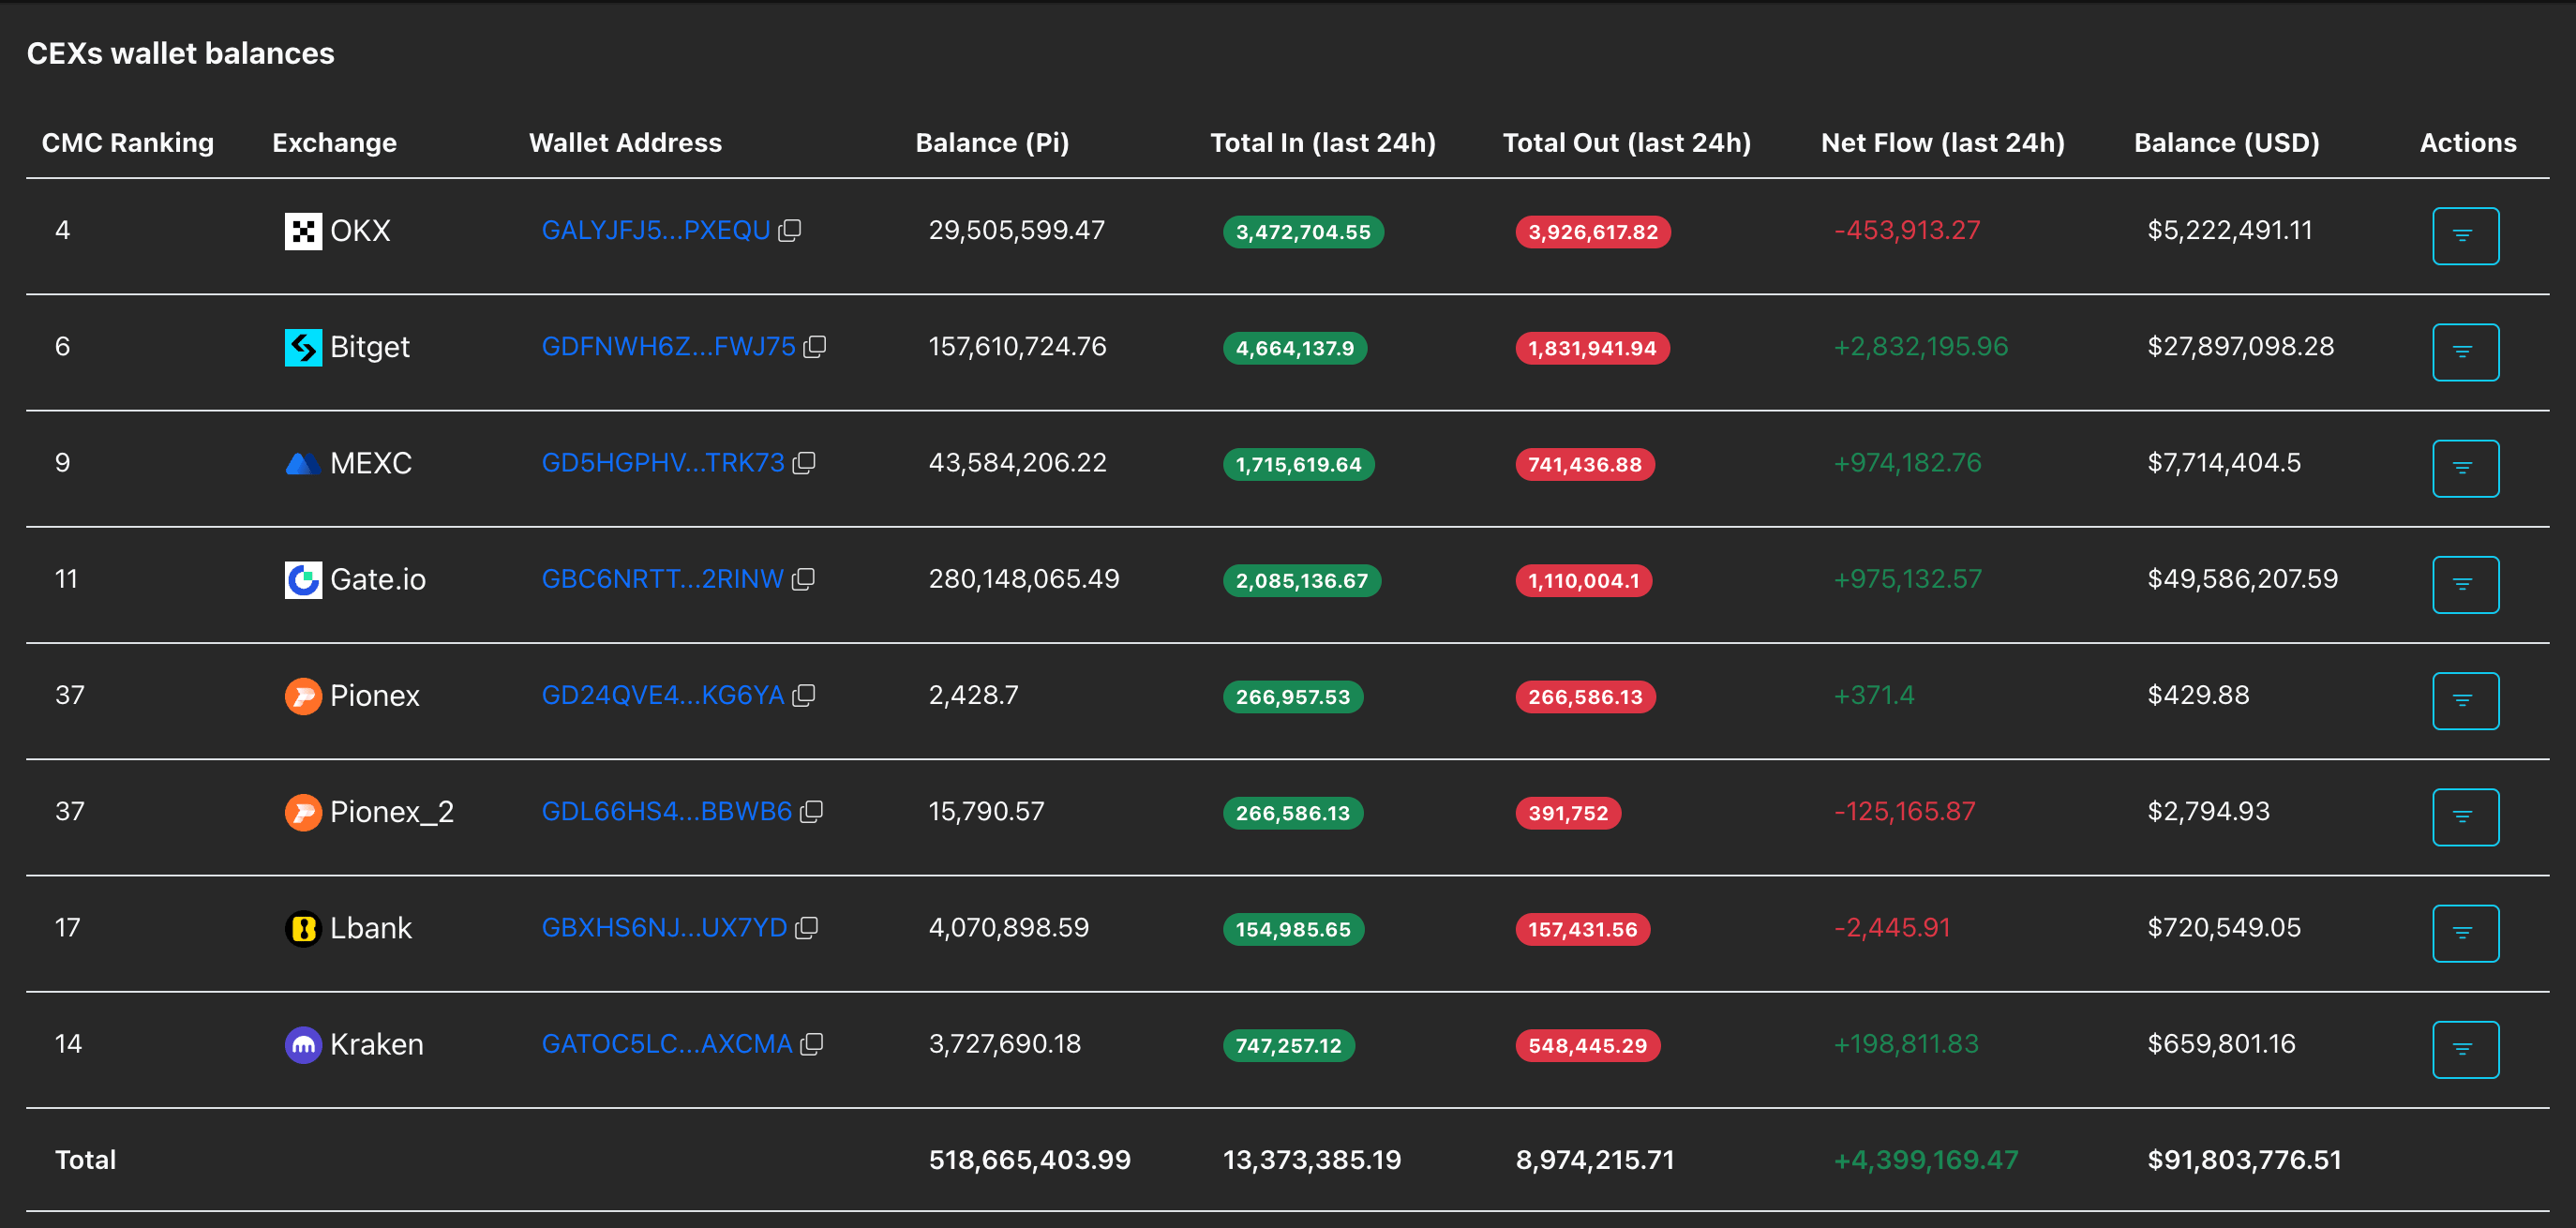
- PiScan data reveals over 4 million PI tokens deposited in 24 hours, weighing down on the spot price.
- The technical outlook for PI turns bearish, risking a close below the 50-day EMA at $0.1780.
Pi Network (PI) trades below $0.1800 at press time on Thursday, under intense selling as exchange deposits cross 4 million PI tokens in 24 hours. The technical outlook for PI is turning bearish as heavy deposits threaten the 50-day Exponential Moving Average (EMA) support at $0.1780.
Heavy CEX inflows weigh down on PI token price
Deposits on Centralized Exchanges (CEXs) serve as available supply pressure, which could lower the spot price if they outweigh demand. PiScan data shows that CEXs recorded 4.39 million PI tokens, indicating a loss of investor confidence. A steady rise in CEX deposits could further extend the decline in Pi Network.
Will Pi Network extend losses below $0.17?
Pi Network trades around $0.1765 at press time on Thursday, with a 7% intraday loss reflecting a mildly bearish near-term bias. The 50-day Exponential Moving Average (EMA) at $0.1780 caps the price at arm’s length, with the 100-day EMA at $0.1848 and the longer-term 200-day EMA at $0.2305 reinforcing a layered overhead supply zone.
The Moving Average Convergence Divergence (MACD) line is still above zero and the signal lines with a modest positive reading, while the Relative Strength Index (RSI) at 49 dips below the midline, suggesting a rise in downside pressure.
A decisive close below the 50-day EMA at $0.1780 could risk a steeper decline to the April 13 low at $0.1633.
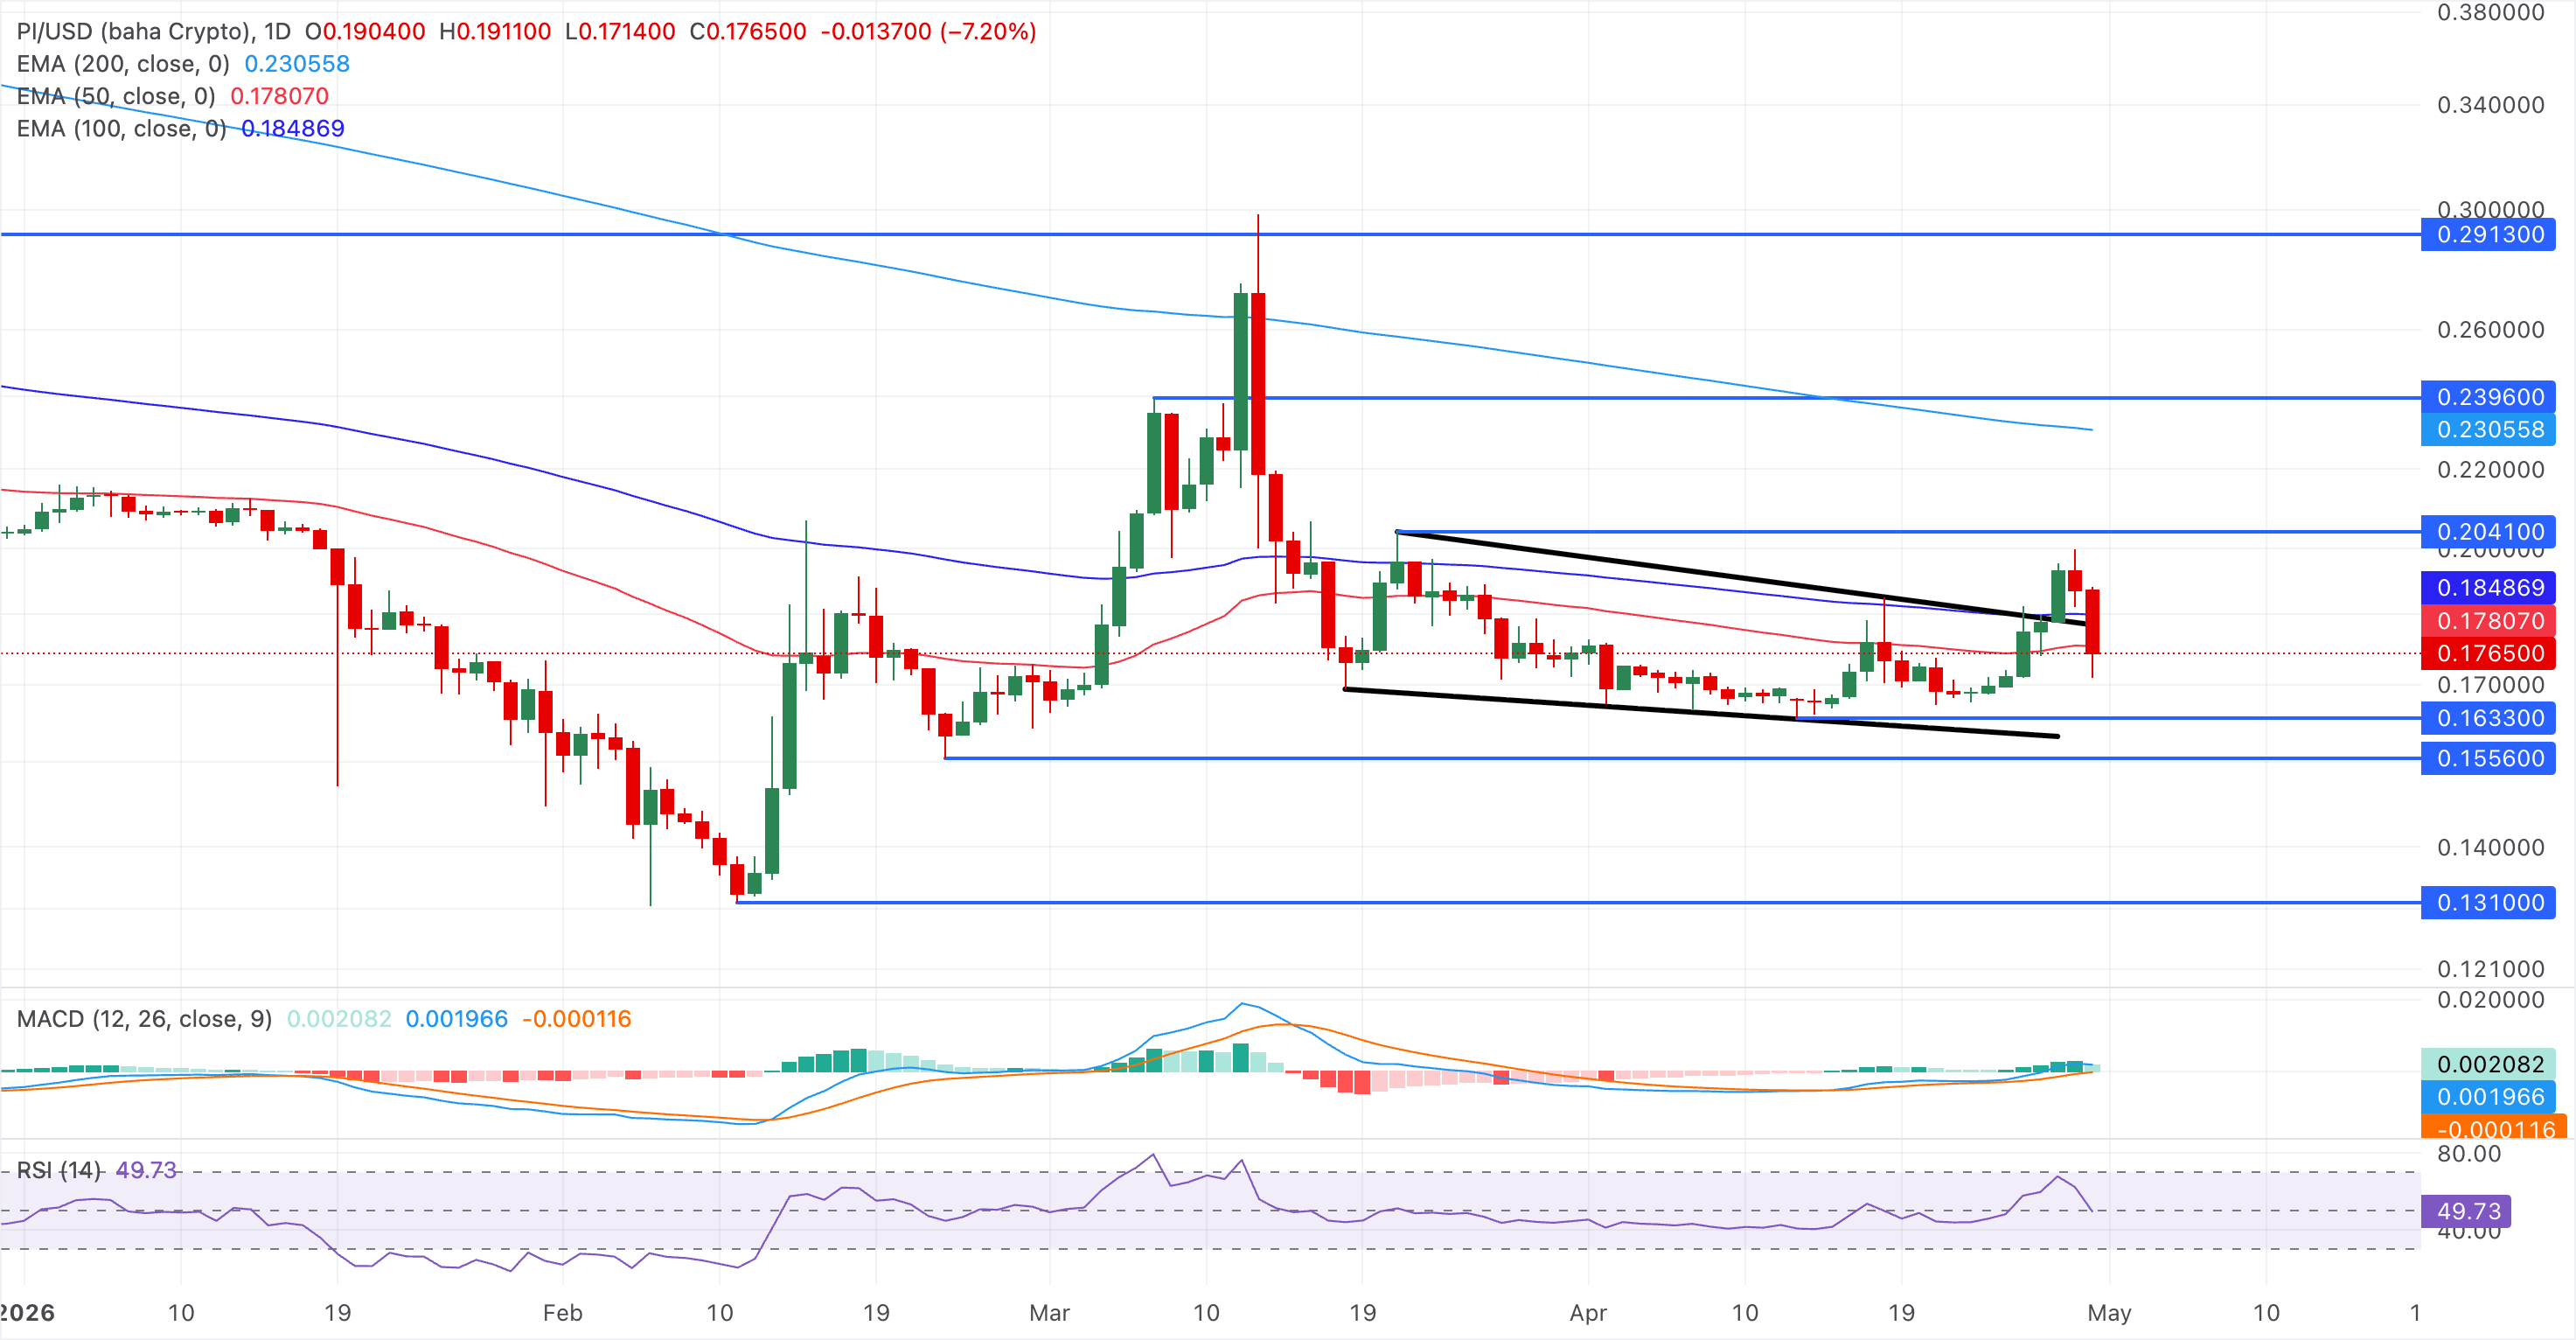
However, a daily close above $0.1780 would ease downside pressure, potentially lifting the spot price toward the March 21 high at $0.2041.
(The technical analysis of this story was written with the help of an AI tool.)
Recommended Articles










Comments (0)
Click the $ button, enter the symbol, and select to link a stock, ETF, or other ticker.