


BNB Price Forecast: BNB maintains a constructive tone amid mixed signals



- BNB is marginally above the 50-day EMA at $633.71 on Thursday, suggesting a slightly constructive near-term tone.
- Mixed on-chain and derivatives data caps BNB’s upside momentum.
- The technical outlook suggests an upside potential as momentum indicators signal a bullish bias.
BNB (BNB), formerly known as Binance Coin, trades slightly above the key support zone near $633.71 on Thursday, hinting at a mild constructive near-term tone. Mixed signals from on-chain and derivatives data keep the lid on the upside, while improving momentum indicators suggest a potential bullish move ahead for BNB.
Mixed signals with a slight bullish tilt
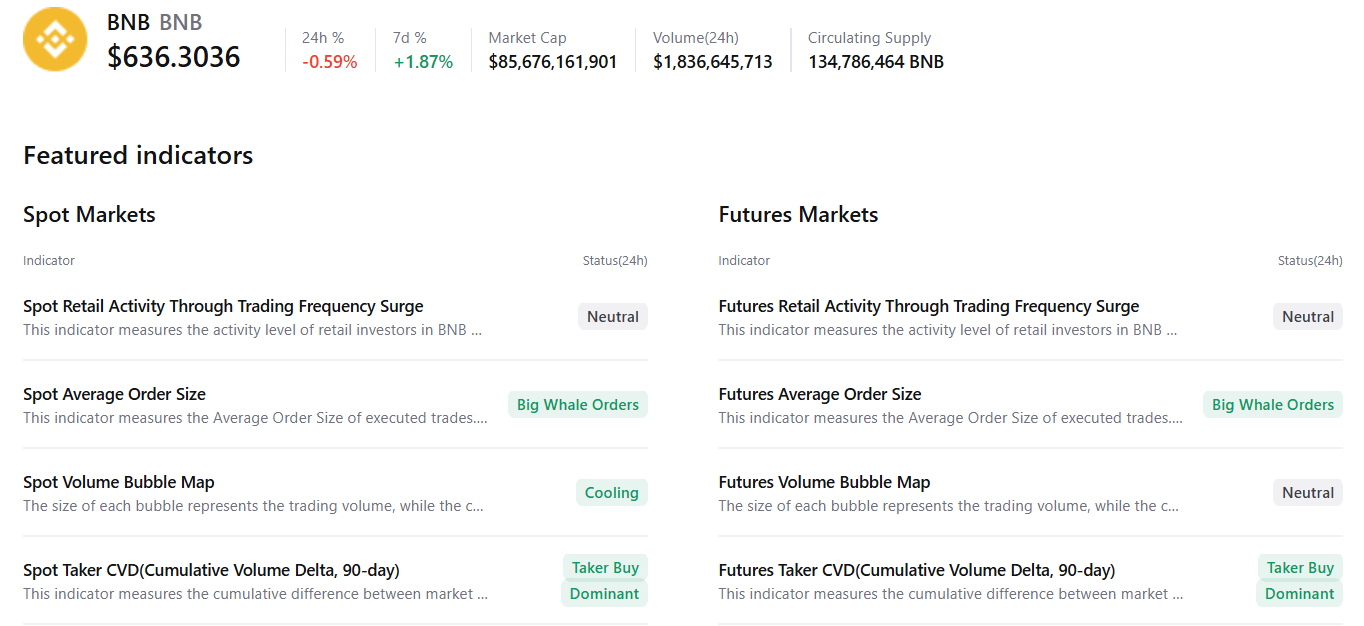
CryptoQuant summary data suggests a bullish outlook for BNB. Spot and futures markets show the presence of large whale orders and buy-side dominance, suggesting a potential upside move.
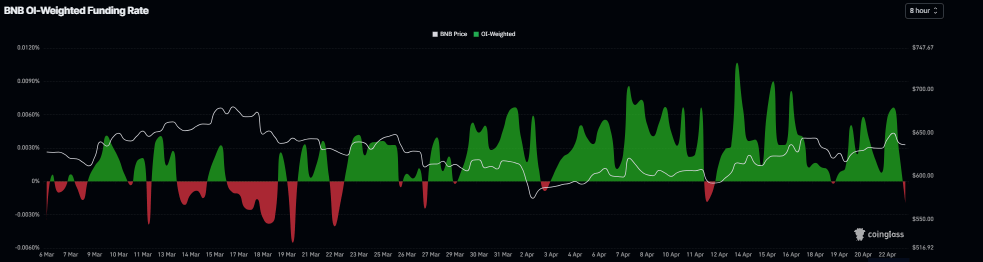
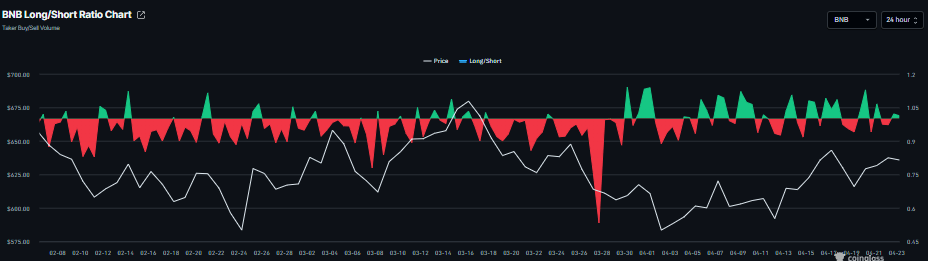
On the derivatives side, sentiment remains mixed. CoinGlass’ OI-Weighted Funding Rate data for Cardano flipped negative on Thursday, reading -0.0019%, indicating that shorts are paying the longs and projecting a bearish outlook. However, the long-to-short ratio reads 1.02 on Thursday, slightly above one, with no clear direction bias in traders’ positioning.
This combination suggests indecision among BNB investors, limiting the likelihood of a sustained upside move.
BNB Price Forecast: Hovers near key support zone
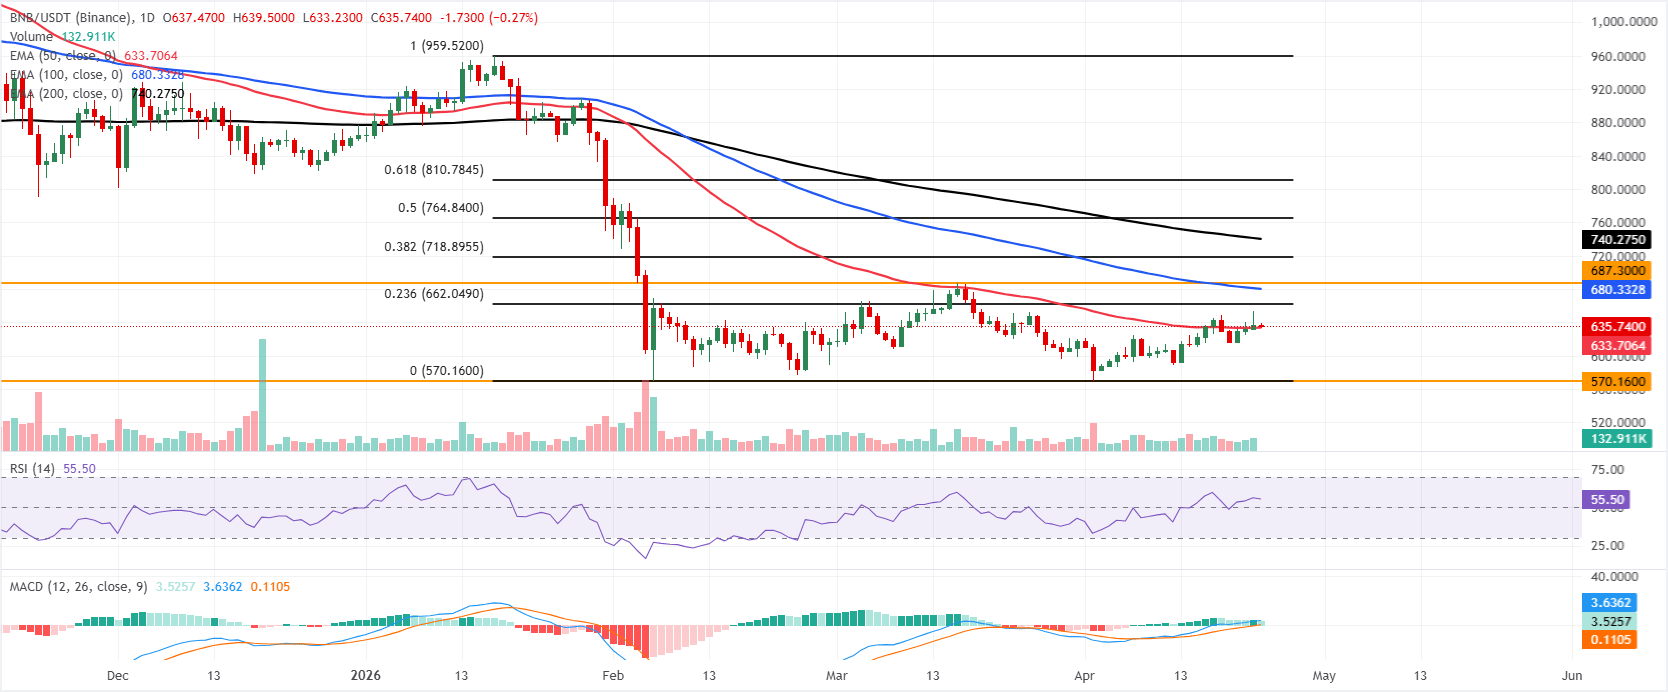
BNB trades at $636.30 on Thursday as it holds marginally above the 50-day Exponential Moving Average (EMA) at $633.71, giving the near-term tone a slightly constructive bias, although the broader structure remains capped by the 100-day EMA at $680.33 and the 200-day EMA at $740.28 overhead.
The Relative Strength Index (RSI) on the daily chart is about 56, leaning positive without signaling overbought conditions, while the Moving Average Convergence Divergence (MACD) remains in positive territory, suggesting buyers retain some control but still face significant overhead supply.
On the topside, initial resistance is aligned with the 23.6% Fibonacci retracement (drawn from January high to February low) at $662.05, followed by the 100-day EMA at $680.33 and the nearby horizontal barrier at $687.30. Above these, the 38.2% Fibonacci retracement at $718.90 and the 200-day EMA at $740.28 form a more substantial medium-term ceiling, ahead of higher retracement hurdles at $764.84 and $810.78.
On the downside, immediate support is provided by the 50-day EMA at $633.71. A break below this level would expose the more distant structural floor around the Fibonacci anchor and horizontal support at $570.16.
(The technical analysis of this story was written with the help of an AI tool.)
Recommended Articles









Comments (0)
Click the $ button, enter the symbol, and select to link a stock, ETF, or other ticker.