


Hyperliquid Price Forecast: HYPE steadies around $40 amid mixed retail outlook



- Hyperliquid holds steady around $40 on Thursday, after gaining over 3% the previous day.
- Recovering HYPE futures Open Interest, despite negative funding rates, reflects a mixed retail outlook.
- The technical outlook for HYPE is cautiously optimistic, as the price is forming a rising wedge pattern.
Hyperliquid (HYPE) trades around $40 at press time on Thursday, holding steady after over 3% gains the previous day. The decentralized exchange (DEX) token struggles to retain retail demand in the leverage market, while the technical outlook highlights a rising wedge pattern in the making, keeping the broader bias neutral-to-bearish.
HYPE futures market in limbo
Hyperliquid gained retail traction during the peak of the US-Iran conflict over the Strait of Hormuz, as it provided a 24/7 platform for commodities trading, including Oil and precious metals. However, the easing of pressure in the Middle East, with the US indefinitely extending the deadline for Iran’s peace proposal, aligns with a reduction in retail interest in Hyperliquid.
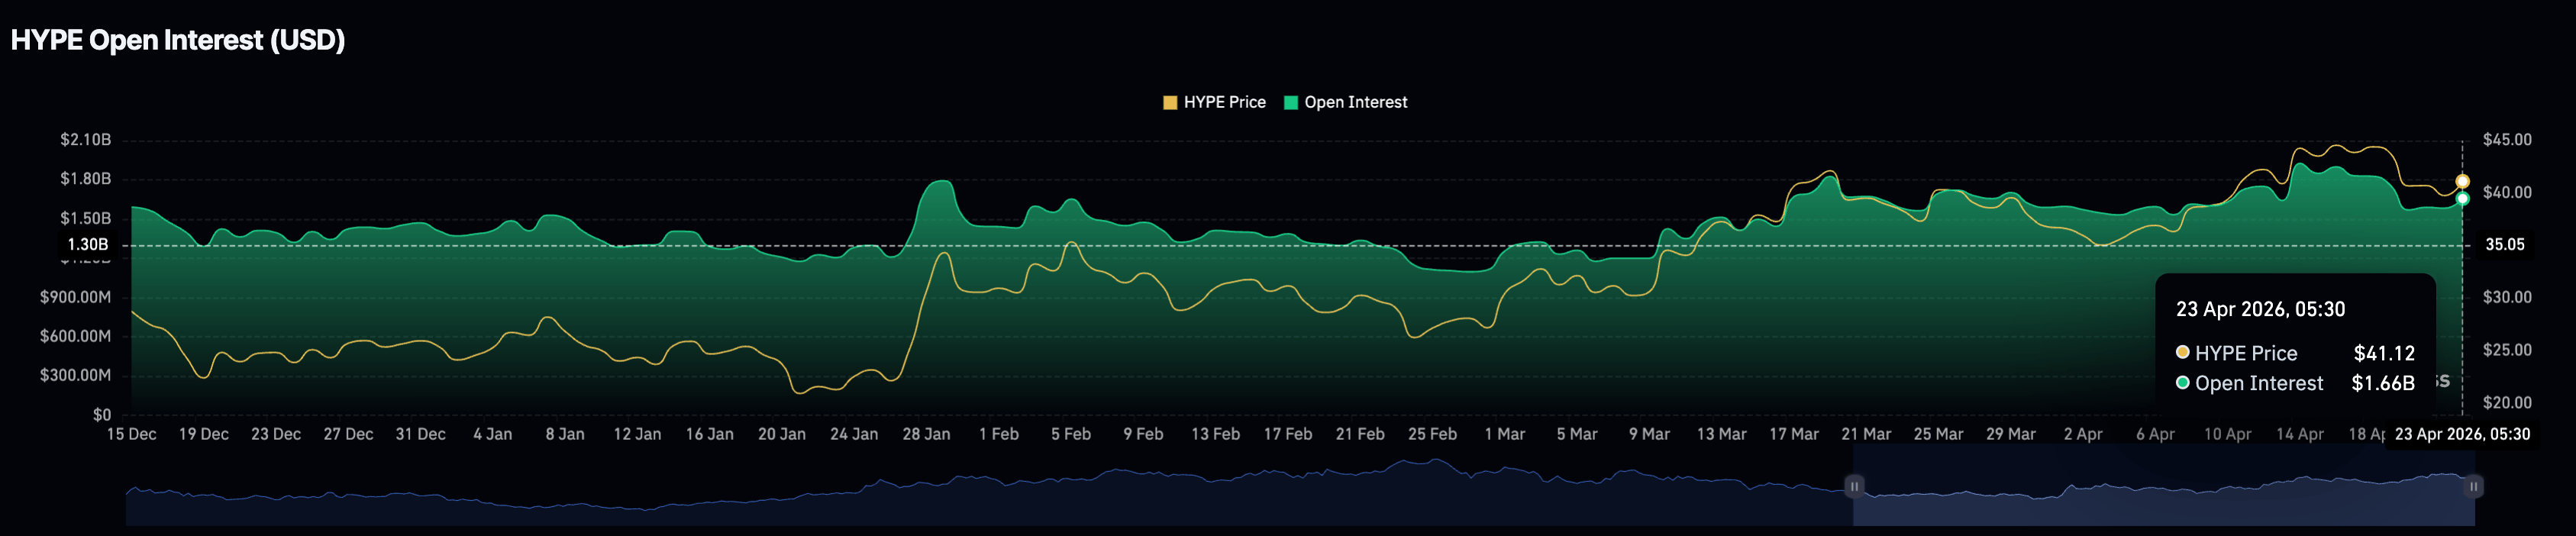
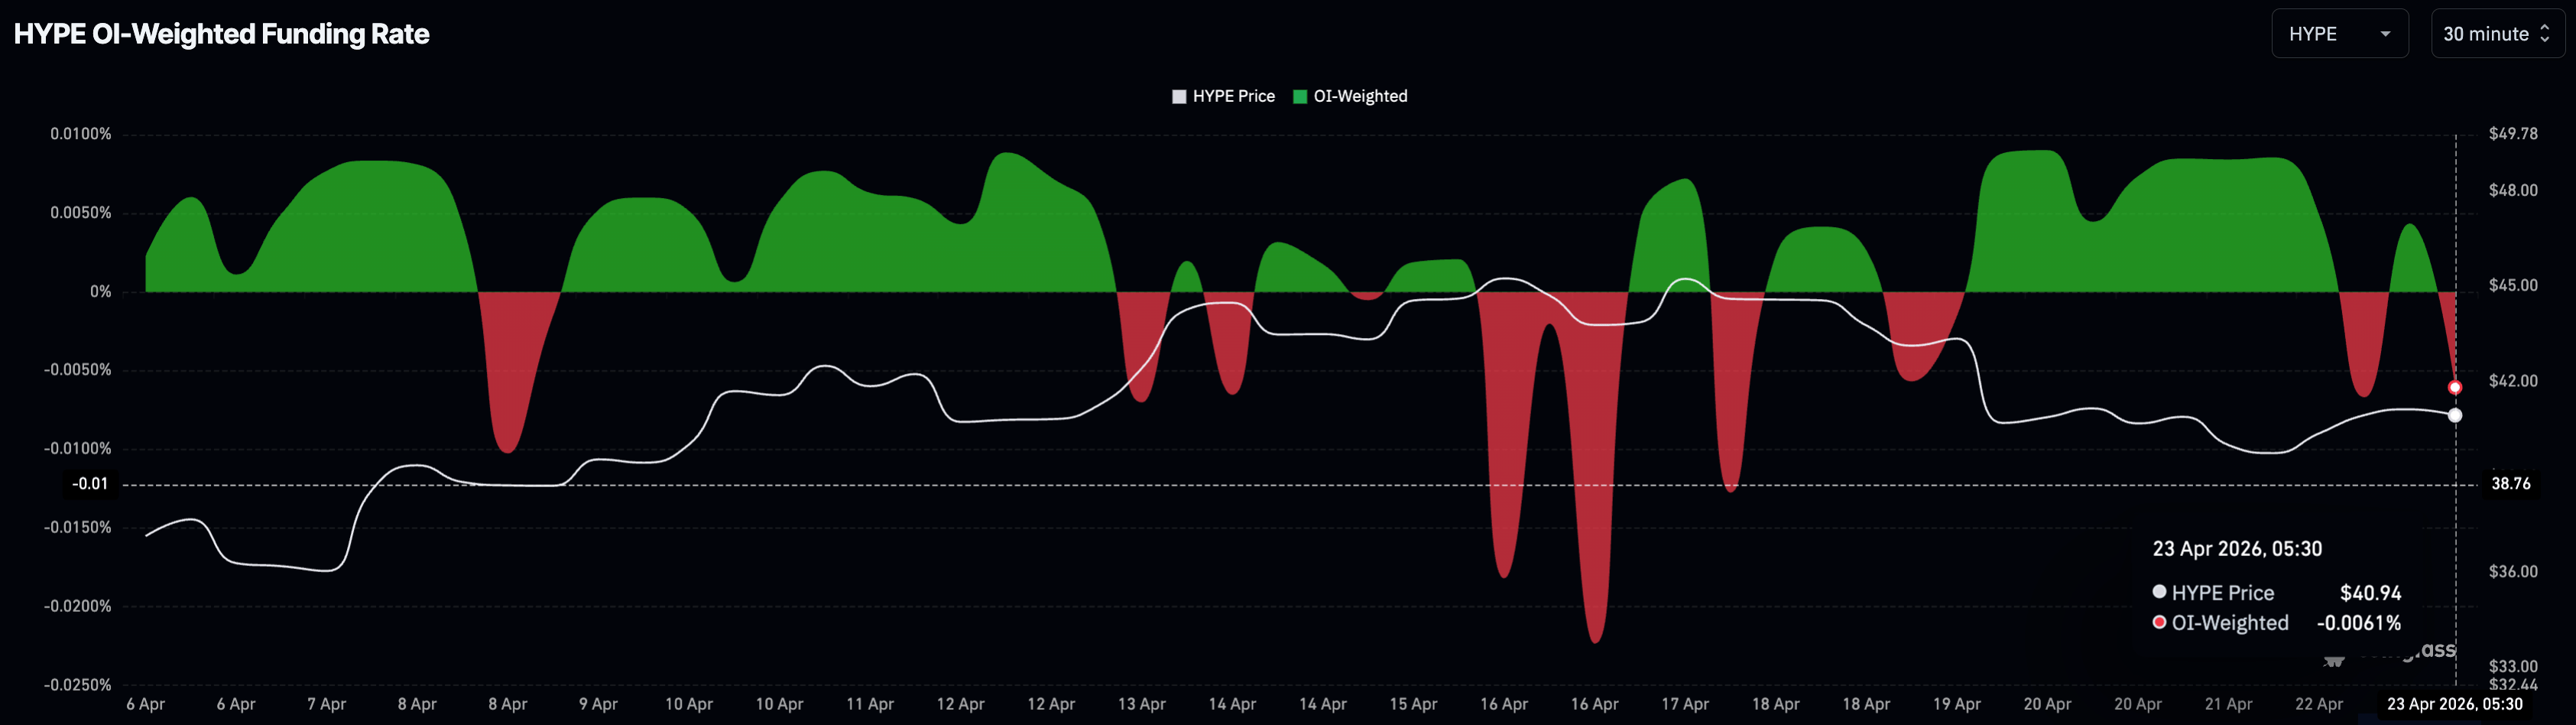
CoinGlass data shows the HYPE futures Open Interest stands at $1.66 billion, maintaining a broadly sideways trend, suggesting traders' participation is plateauing. However, the funding rate is negative at -0.0061%, indicating that buyers are willing to take short positions at a premium, anticipating a downside in HYPE's price.
Will Hyperliquid extend its recovery?
Hyperliquid holds above the 50-day Exponential Moving Average (EMA) near $38.46 and the 200-day EMA at $34.51, while also staying over an ascending support trendline, which collectively keeps the near-term bias tilted to the upside. However, the support trendline forms a rising wedge pattern on the daily chart with an overhead converging trendline, which typically results in a downside breakout.
The Moving Average Convergence Divergence (MACD) sits in negative territory, hinting at waning bullish momentum, but the Relative Strength Index (RSI) at 52 suggests only modest, rather than aggressive, selling pressure at current levels.
On the downside, initial support is located at the rising trendline area near $40.33, where a break would expose the 50-day EMA at $38.46 as the next notable floor, ahead of more distant structural support at the 200-day EMA around $34.51.
Looking up, the R1 Pivot Point at $43.71 serves as the immediate resistance, guarding the upside to the resistance trendline near $45.77.
(The technical analysis of this story was written with the help of an AI tool.)
Recommended Articles









Comments (0)
Click the $ button, enter the symbol, and select to link a stock, ETF, or other ticker.