


Stellar Price Forecast: XLM flips south as leverage market loses confidence



- Stellar extends losses on Thursday after the 100-day EMA capped its short-term recovery run.
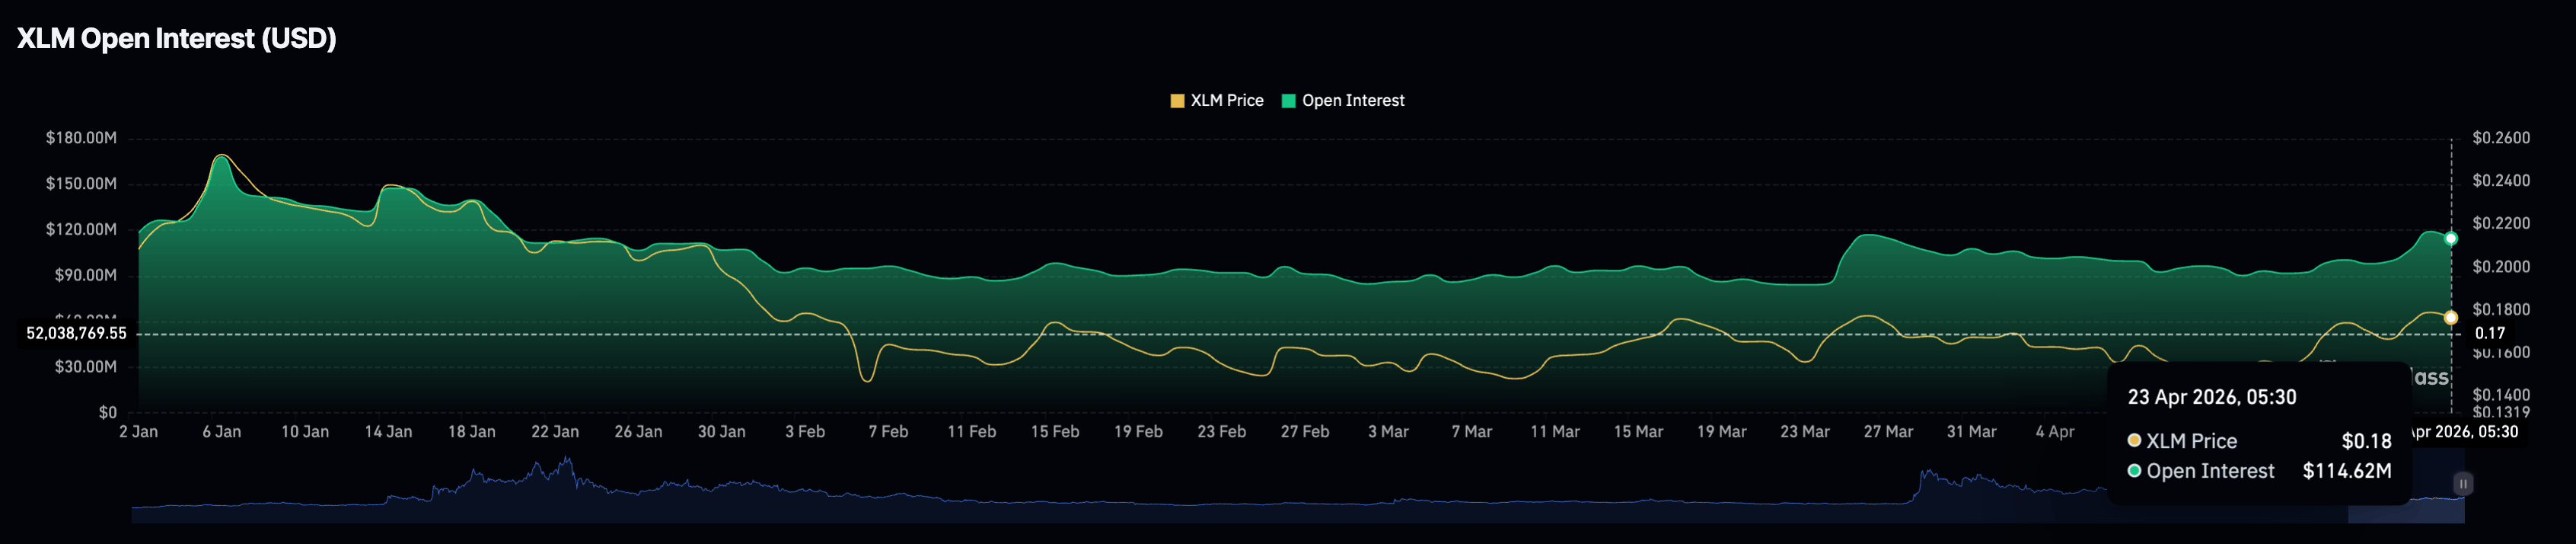
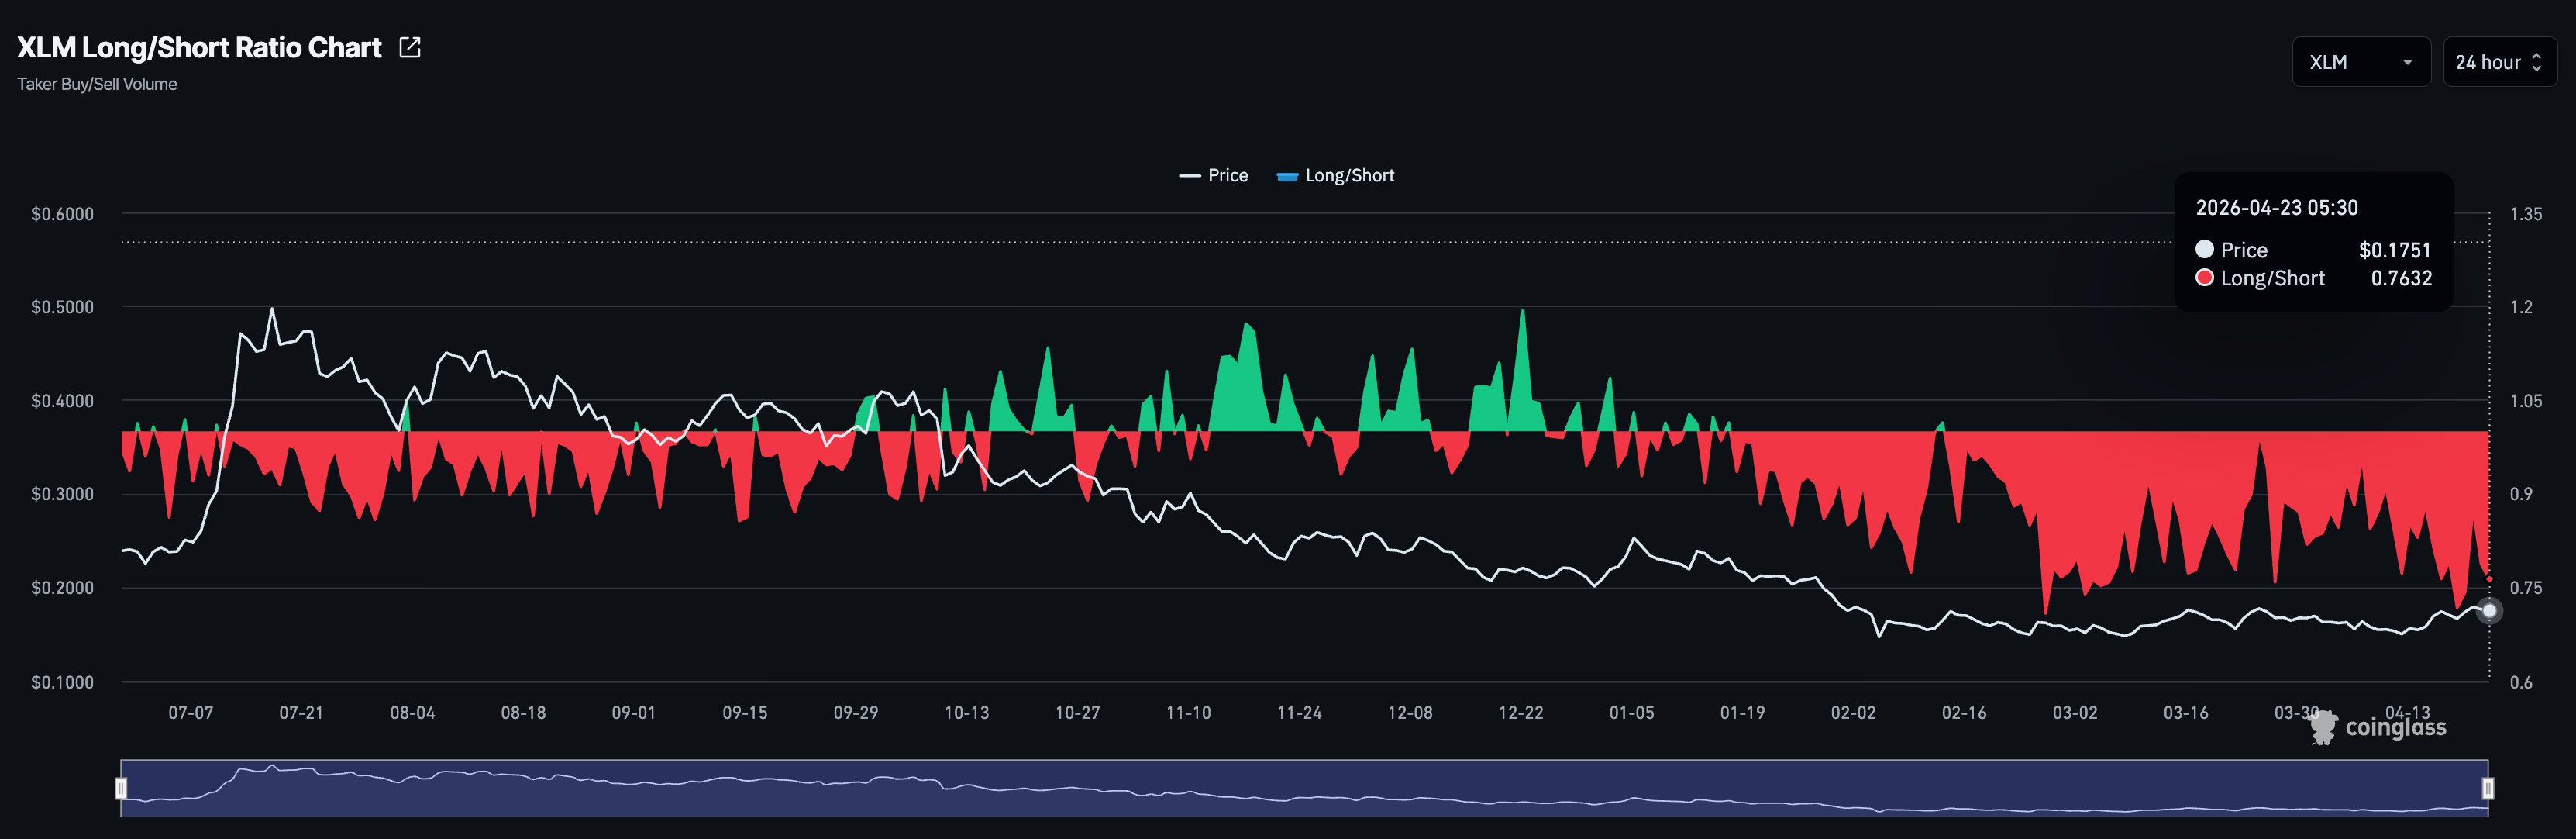
- XLM futures Open Interest holds steady, but the declining long-to-short ratio signals a bearish bias.
- The technical outlook for XLM is mildly bearish, with the pullback targeting the 50-day EMA.
Stellar (XLM) extends losses at press time on Thursday, as the 100-day Exponential Moving Average (EMA) at $0.1798 caps short-term recovery, keeping the tone bearish. The leverage market remains bearish on XLM, with active short positions rising. Technically, the reversal from the 100-day EMA threatens a pullback to the consolidation support level at $0.1471.
The leverage market anticipates further decline in XLM
Stellar is losing demand in its derivatives market as it continues to consolidate below crucial moving averages. CoinGlass data shows the XLM futures Open Interest (OI) stands at $114.62 million, holding steady after a surge from $99.45 million on Monday.
However, the ratio of active long to short positions stands at 0.7632, consistently below 1 since mid-January, indicating that traders anticipate a further downside in XLM.
Will XLM break below $0.1500?
Stellar trades in the red at press time on Thursday, extending the losses from Wednesday. XLM holds above the 50-day Exponential Moving Average (EMA) at $0.1669, but remains capped by the 100-day EMA at $0.1798, keeping the broader tone neutral-to-bearish.
Momentum readings are constructive, with the Relative Strength Index (RSI) at 59 on the daily chart, hovering just above the midline, and the Moving Average Convergence Divergence (MACD) remaining above its signal line, which hints that buyers still have some control.
Looking down, the 50-day EMA at $0.1669 serves as the first layer of support; a break below it would weaken the current recovery and open the door to the $0.1471 support floor, which has held the price since early February.
On the topside, initial resistance is located at the 100-day EMA around $0.1798, and a daily close above this level would be needed to expose the next, more significant barrier at the 200-day EMA at $0.2101.
(The technical analysis of this story was written with the help of an AI tool.)
Recommended Articles









Comments (0)
Click the $ button, enter the symbol, and select to link a stock, ETF, or other ticker.