


Cosmos Hub Price Forecast: ATOM extends gains as bullish derivatives data supports upside, BTC surges to $77,500



- Cosmos Hub price extends its rally on Wednesday, gaining nearly 8% so far this week.
- Derivatives data points to a bullish outlook, with rising open interest and positive funding rates among ATOM traders.
- The technical outlook remains constructive, as momentum indicators remain bullish, while Bitcoin’s surge toward $77,500 adds further support to the broader market outlook.
Cosmos Hub (ATOM) price extends its gains, trading above $1.89 on Wednesday, rallying nearly 8% so far this week as Bitcoin’s (BTC) surge toward $77,500 supports broader crypto strength. Improving derivatives metrics and constructive technical outlook suggesting further upside potential for ATOM in the near term.
Derivatives data suggests a bullish bias
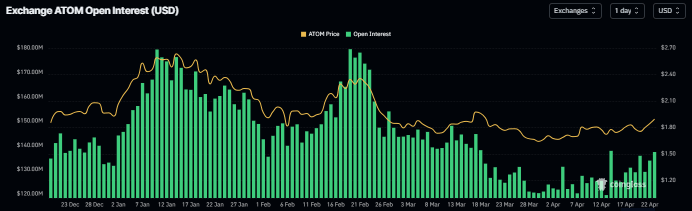
CoinGlass Open Interest (OI) for ATOM surges to $137.18 million on Wednesday, up from $125 million on April 15 and has been rising steadily since then. An increasing OI indicates new or additional money entering the market and new buying, which could fuel a rally in the ATOM price.
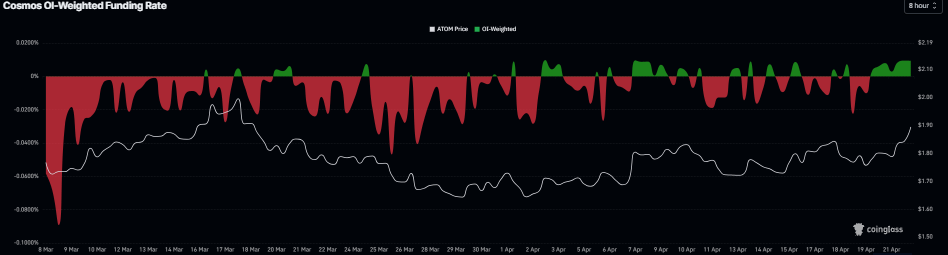
In addition, the funding rates also show a bullish bias. ATOM’s funding rates flipped positive on Monday and rose to 0.0093% on Wednesday, indicating that the longs are paying the shorts. Historically, when rates have turned positive and risen, the Cosmos Hub price has surged sharply.
Cosmos Hub Price Forecast: ATOM near the descending trendline
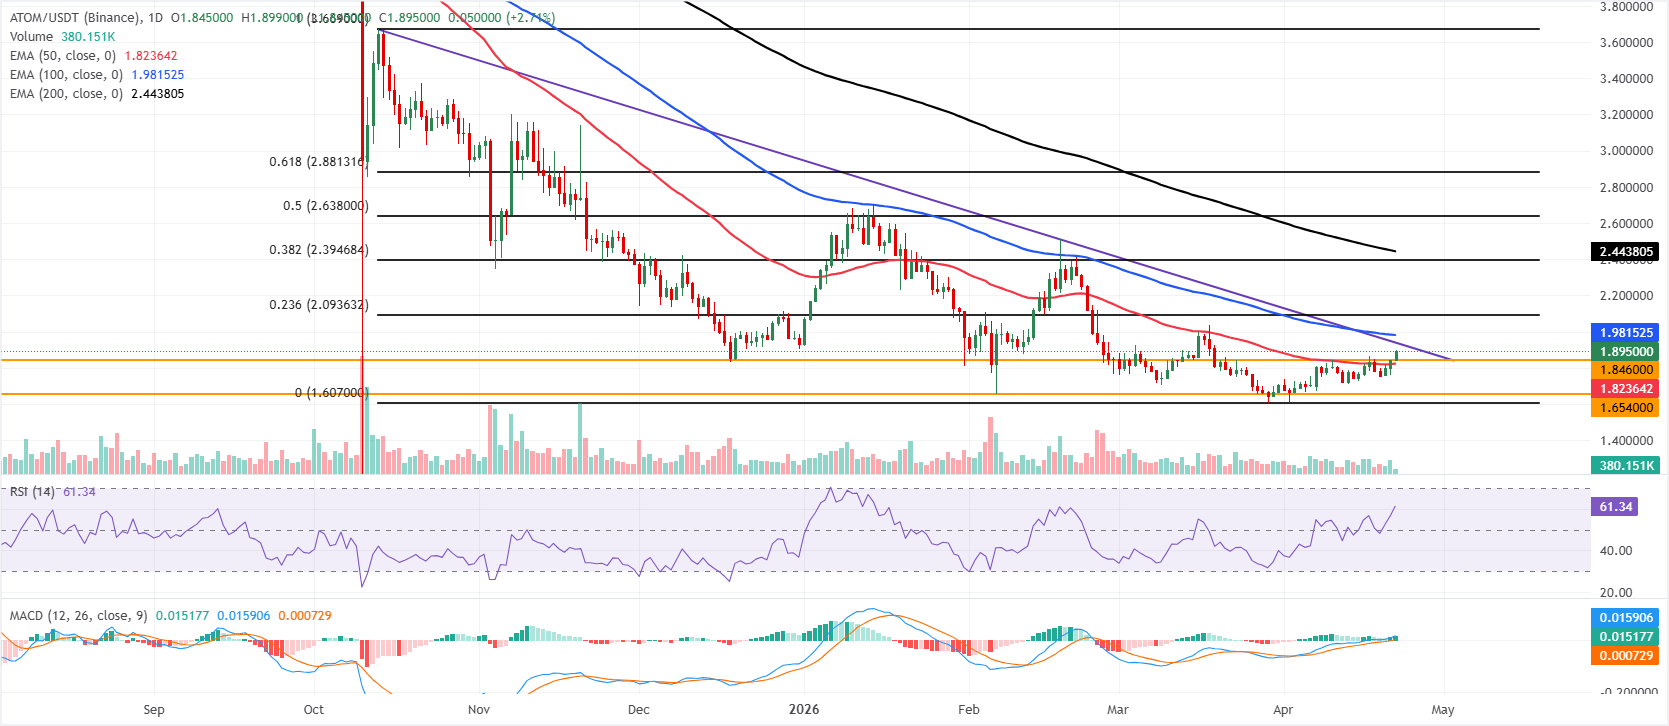
ATOM is trading above $1.89 on Wednesday, maintaining a broadly capped tone as it holds above the 50-day Exponential Moving Average (EMA) at $1.82 but remains well below the 100- and 200-day EMAs at $1.98 and $2.44. ATOM is attempting to build a base after reclaiming nearby dynamic support, while the long-standing downward-sloping trendline, around $1.93, continues to define the immediate topside cap.
A rising Relative Strength Index (RSI) on the daily chart near 61 and a positive, expanding Moving Average Convergence Divergence (MACD) histogram hint that upside momentum is improving, yet these signals only soften, rather than reverse, the prevailing medium-term bearish backdrop set by the higher EMAs.
On the topside, initial resistance is clustered at the descending trendline break area near $1.93, followed by the 23.6% Fibonacci retracement of the $3.66–$1.60 decline at $2.09. Beyond that, the 38.2% retracement at $2.39 aligns with the 200-day EMA at $2.44 to form a more formidable barrier before the 50% retracement at $2.63.
On the downside, immediate support is seen at the horizontal level around $1.84, ahead of the 50-day EMA at $1.82; a break below these levels would expose the next floors at $1.65 and the cycle low area near $1.60, where bearish pressure could begin to exhaust.
(The technical analysis of this story was written with the help of an AI tool.)
Recommended Articles










Comments (0)
Click the $ button, enter the symbol, and select to link a stock, ETF, or other ticker.