


Ethereum Flips Key Resistance, ETF Demand Returns, Analysts Eye Next Leg Higher



Ethereum is flashing a combination of technical and on-chain signals that analysts say could be the beginning of a meaningful recovery. For the first time in months, the structure of Ethereum’s price action appears to be shifting in the favor of bulls.
The latest price action has brought the ETH price back above $2,300, setting up a structure that says the next leg is about to start.
Technical Levels Reset, Analyst Flags Breakout Conditions
Crypto analyst Ash Crypto drew attention to Ethereum’s price action this week, pointing to three developments that, taken together, suggest the groundwork for a new upward leg may be forming.
The first major development in Ethereum’s recent price action is its move back above the 100-day simple moving average. This level had acted as dynamic resistance, consistently capping upside attempts since November 2025. The break above it changes the tone of the chart, as it suggests that buyers are starting to regain control on higher timeframes.
Second, a resistance zone that repeatedly rejected price throughout Q1 2026 has now been flipped into a support area. The chart shared by Ash Crypto shows a rising trendline from the February lows supporting price from below and creating a tightening range alongside a support zone to create an ascending triangle pattern.
ETH has since broken above the upper boundary of that triangle and is now testing the horizontal resistance band in the $2,300 to $2,370 range. According to the analyst, all Ethereum needs to do now is just hold above the $2,300 level, and the next leg up will start. At the time of writing, Ethereum is trading at $2,316.
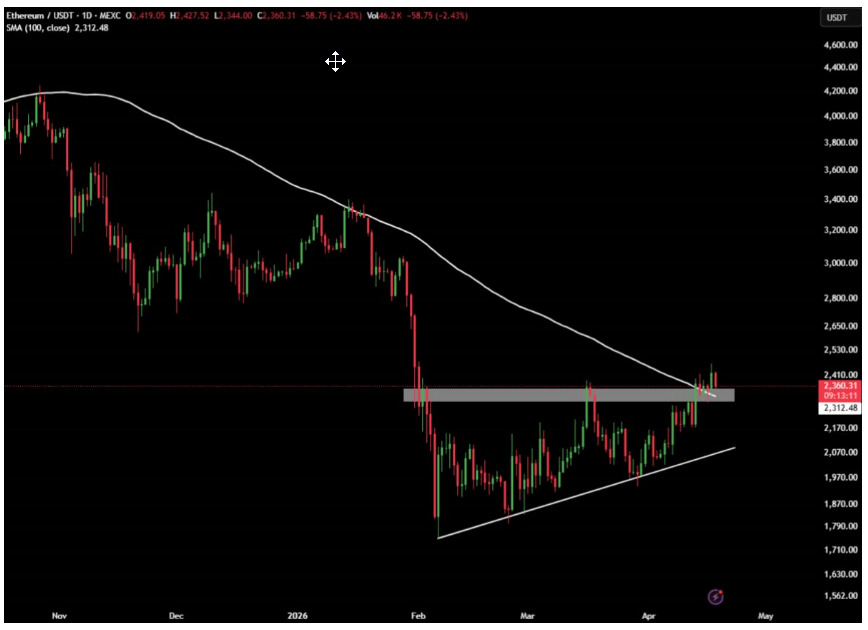
Ethereum Price Chart. Source: @AshCrypto On X
Institutional Demand Returns Through ETF Channel
The third major development is the return of institutional inflows through US Spot Ethereum ETFs. Particularly, US Spot Ether ETFs recorded $275.83 million in inflows in the most recent week, which is their strongest weekly inflow since the week ending January 16.
Perhaps the most compelling evidence of a changing market dynamic comes from derivatives order flow data. Throughout this cycle, Ethereum has faced persistently negative net taker volume.
This is a metric that measures the difference between buy and sell market orders on derivatives exchanges, and the negative reading means sellers were consistently overpowering buyers.
That pattern has now reversed. As noted by CryptoQuant analyst Darkfost, buy-side volumes have taken control on derivatives markets for the first time in the cycle, with a net taker volume reading of +$102 million recorded recently.
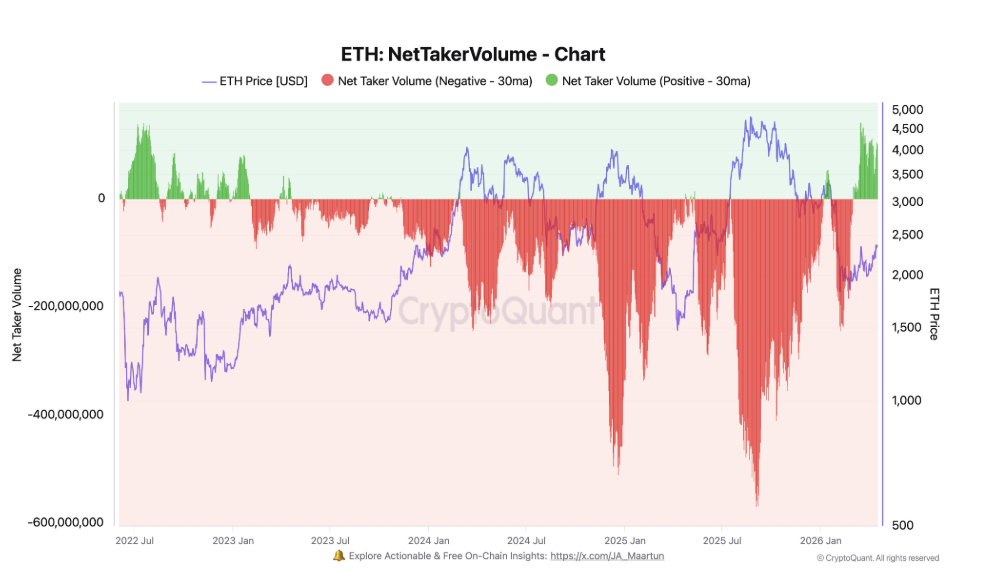
ETH: NetTakerVolume. Source: @Darkfost_Coc On X
The last time Ethereum recorded buying pressure of this magnitude on derivatives markets was during the bear market of 2022, when ETH was trading around $1,000. If this trend manages to persist and buyers continue to absorb selling pressure, then it could indicate the early stages of a stronger structural recovery for Ethereum.
Featured image from Unsplash, chart from TradingView
Recommended Articles










Comments (0)
Click the $ button, enter the symbol, and select to link a stock, ETF, or other ticker.