


Bitcoin Price Only Inches Away From Historical Bottom, Here’s The Level



Bitcoin is approaching a price level that has, without exception, led to the absolute bottom of every major bear market cycle in its history, and on-chain indicators show the moment of maximum opportunity may be drawing near for Bitcoin traders to capitalize on an incoming rally.
Bitcoin’s Historical Bottom At The 200-Week Moving Average
One technical level has held with incredible consistency throughout more than a decade of Bitcoin’s price history. This technical level is, in fact, the 200-week moving average. Bitcoin has never closed a weekly candle meaningfully below the long-term 200-week moving average, even during the pandemic-era crash of 2020 and the cycle bottom of late 2022, and has, in each instance, staged a powerful recovery every time it touched it.
The chart below shows Bitcoin moving in cycles, with each correction eventually cooling off near this long-term average before the beginning of a rally phase. Notably, the Bitcoin price action followed this same script in 2015, 2018, and 2022. Each time, extended drawdowns ended only after Bitcoin touched or briefly dipped below the 200-week moving average.
The chart also adds a 14-month Relative Strength Index reading directly onto price via a color-coded dot system. Red dots highlight overbought euphoria around cycle peaks, while blue dots signal deeply oversold conditions consistent with capitulation bottoms. Green and yellow dots, on the other hand, populate the recovery and mid-cycle expansion phases in between.
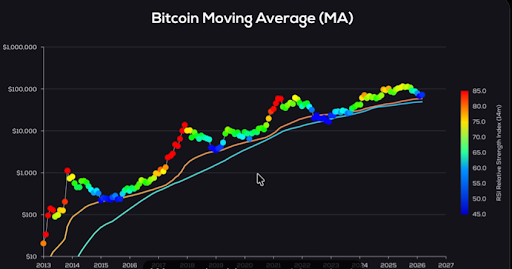
At present, BTC is trading just above that same line once again, placing the price in a position that has historically led to a bottom. Blue dots are once again beginning to form along the current price trajectory. This is precisely the RSI pattern that appeared at the 2015 bottom, the 2018-2019 bottom, and the 2022 bottom.
If history holds, then the distance between the current price and a confirmed cycle bottom may be very small indeed. Bitcoin can either start a new rally from here or reverse from here to retest $60,000 again before embarking on the rally.
A Larger Breakout Structure Points To $500,000
According to crypto analyst Coinvo Trading, a multi-year Cup and Handle formation is playing out on Bitcoin’s monthly chart. The bullish structure stretches across several years, with the rounded cup forming from mid-2021 to early 2025. The breakout of neckline resistance occurred in 2025, and the handle stage of the pattern has been forming since then.
As it stands, BTC is now approaching the final stages of this formation. Coinvo Trading projected the measured price target for this breakout at $505,761, which is derived from projecting the full depth of the cup formation above the breakout level. “Once it breaks, you’re too late,” the analyst warned.
Recommended Articles









Comments (0)
Click the $ button, enter the symbol, and select to link a stock, ETF, or other ticker.