


Solana Tests $80 Support as Futures Data Signals Rising Liquidation Risk



Solana’s (SOL) latest price action is drawing increased attention from traders as derivatives data and technical indicators converge around a critical level.
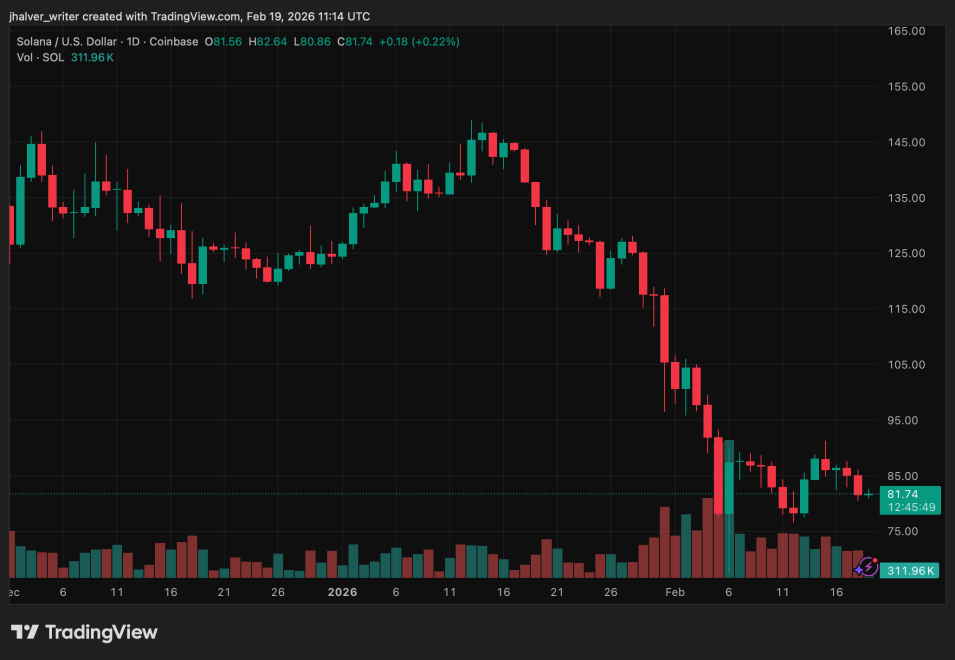
With SOL trading near $80 after a sharp decline, futures markets are showing signs of stress, while broader ecosystem developments present a contrasting longer-term narrative. The coming sessions may determine whether the current pullback stabilizes or evolves into a deeper correction.
Futures Market Pressure Builds Around Key Support
Recent derivatives data show mounting liquidation risk as leveraged bullish positions unwind. According to market analytics, falling open interest alongside negative funding rates suggests traders are closing positions rather than adding new exposure. This typically signals weakening confidence in short-term price recovery.
As SOL approaches the psychologically important $80 mark, long liquidations have accelerated. Forced selling in futures markets can amplify downward moves, creating a feedback loop where declining prices trigger additional liquidations.
Analysts note that a confirmed break below $80 could expose lower support zones near $75 and potentially the $70–$60 range if bearish momentum persists.
Technical structures reinforce the cautious outlook. A weekly head-and-shoulders pattern and a developing bear flag on lower timeframes both point to downside risks, with some projections targeting the $50–$57 region if support fails.
Mixed Signals From Technical Indicators and Market Sentiment
Despite persistent selling pressure, some indicators suggest the market may be nearing exhaustion. RSI readings hover close to oversold territory, historically a zone where short-term rebounds can occur. However, momentum indicators and trend strength measurements still favor sellers.
Funding rates turning negative also reveal a shift in positioning, with short exposure increasing across derivatives markets. Data referenced by Santiment shows declining social activity and fading speculative interest compared with 2025 highs, reflecting cooler sentiment across the Solana ecosystem.
Short-term resistance remains clustered between $83 and $90, while failure to reclaim those levels keeps the broader downtrend intact.
Institutional Growth Offers Longer-Term SupportWhile price action remains fragile, network fundamentals continue to show expansion.
Research from Messari indicates that RWA value on Solana grew nearly 59% quarter-over-quarter to reach $1.1 billion. Much of the increase has been driven by tokenized treasury products, including funds linked to BlackRock and yield products from Ondo Finance.
Total value locked on the network is also approaching $10 billion, highlighting continued institutional experimentation with tokenized finance despite market volatility.
For now, traders remain focused on whether buyers defend the $80 level. A successful hold could stabilize sentiment and reduce liquidation pressure, while a decisive breakdown may set the stage for another wave of selling across the Solana market.
Cover image from ChatGPT, SOLUSD chart on Tradingview
Recommended Articles







Comments (0)
Click the $ button, enter the symbol, and select to link a stock, ETF, or other ticker.