


Bitcoin Liquidity Remains Intact Despite Precious Metals Rally: Stablecoins Wait On The Sidelines



Bitcoin is struggling to regain the $88,000 level as market uncertainty persists and precious metals continue to rally aggressively. Gold’s strength has reignited a familiar narrative: that capital is leaving Bitcoin to finance the move into traditional safe havens. However, a recent report by CryptoQuant challenges this assumption, suggesting that the current market dynamics are being misinterpreted.
On-chain data indicates that Bitcoin sell-offs are not directly funding the surge in gold and other metals. Instead, liquidity appears to be pausing rather than fleeing the crypto market altogether. This behavior is reflected in the Stablecoin Supply Ratio (SSR), a metric designed to measure the purchasing power of stablecoins relative to Bitcoin’s market capitalization. The SSR offers insight into whether capital is already deployed into BTC or sitting on the sidelines, waiting for clearer conditions.
A lower SSR implies higher latent buying power, meaning stablecoins hold significant capacity to re-enter the market. Conversely, a higher SSR signals that liquidity has largely been committed to Bitcoin. Current readings suggest that capital remains in stablecoins, indicating caution rather than outright risk aversion.
In this context, Bitcoin’s weakness below $88K reflects hesitation, not abandonment. While metals benefit from defensive positioning, on-chain signals point to liquidity waiting for a renewed catalyst in crypto, rather than rotating decisively away from it.
Stablecoin Liquidity Signals a Pause, Not a Capital ExitThe report adds important context by outlining key Stablecoin Supply Ratio (SSR) levels and how they frame Bitcoin’s current market structure. Historically, the SSR has oscillated within well-defined ranges. Readings above 15–16 indicate that stablecoin purchasing power is low, meaning liquidity has largely been deployed into Bitcoin.
Values between 10 and 15 represent a neutral zone, commonly associated with consolidation phases. When the SSR drops below 10–11, latent purchasing power is high, a condition that has often preceded bullish phases. Importantly, these thresholds provide structural context rather than precise timing signals.
At present, the SSR stands at 12.57, down sharply from recent highs in the 18–19 range. This decline signals a transition from fully deployed liquidity toward capital sitting on the sidelines. Despite price weakness, Bitcoin remains structurally stable, suggesting that capital is not exiting the crypto market but waiting for clearer conditions before re-entering.

Crucially, the ongoing rally in gold should not be interpreted as a direct consequence of Bitcoin selling. Large allocators typically operate within diversified, multi-asset frameworks, maintaining exposure across equities, precious metals, digital assets, and stablecoins simultaneously. The lower SSR confirms that capital is not rotating out of Bitcoin into gold, but reallocating risk while remaining within the crypto ecosystem.
Bitcoin Price Remains Below Key Moving Averages
Bitcoin continues to trade under pressure, with price slipping back toward the $87,500–$88,000 zone after another failed attempt to regain momentum above the short-term moving averages. On the daily chart, BTC remains decisively below the 50-day and 100-day averages, both of which are now sloping downward and acting as dynamic resistance. The 200-day moving average, still trending higher above $100,000, reinforces the idea that the broader cycle has shifted from expansion to consolidation or correction.
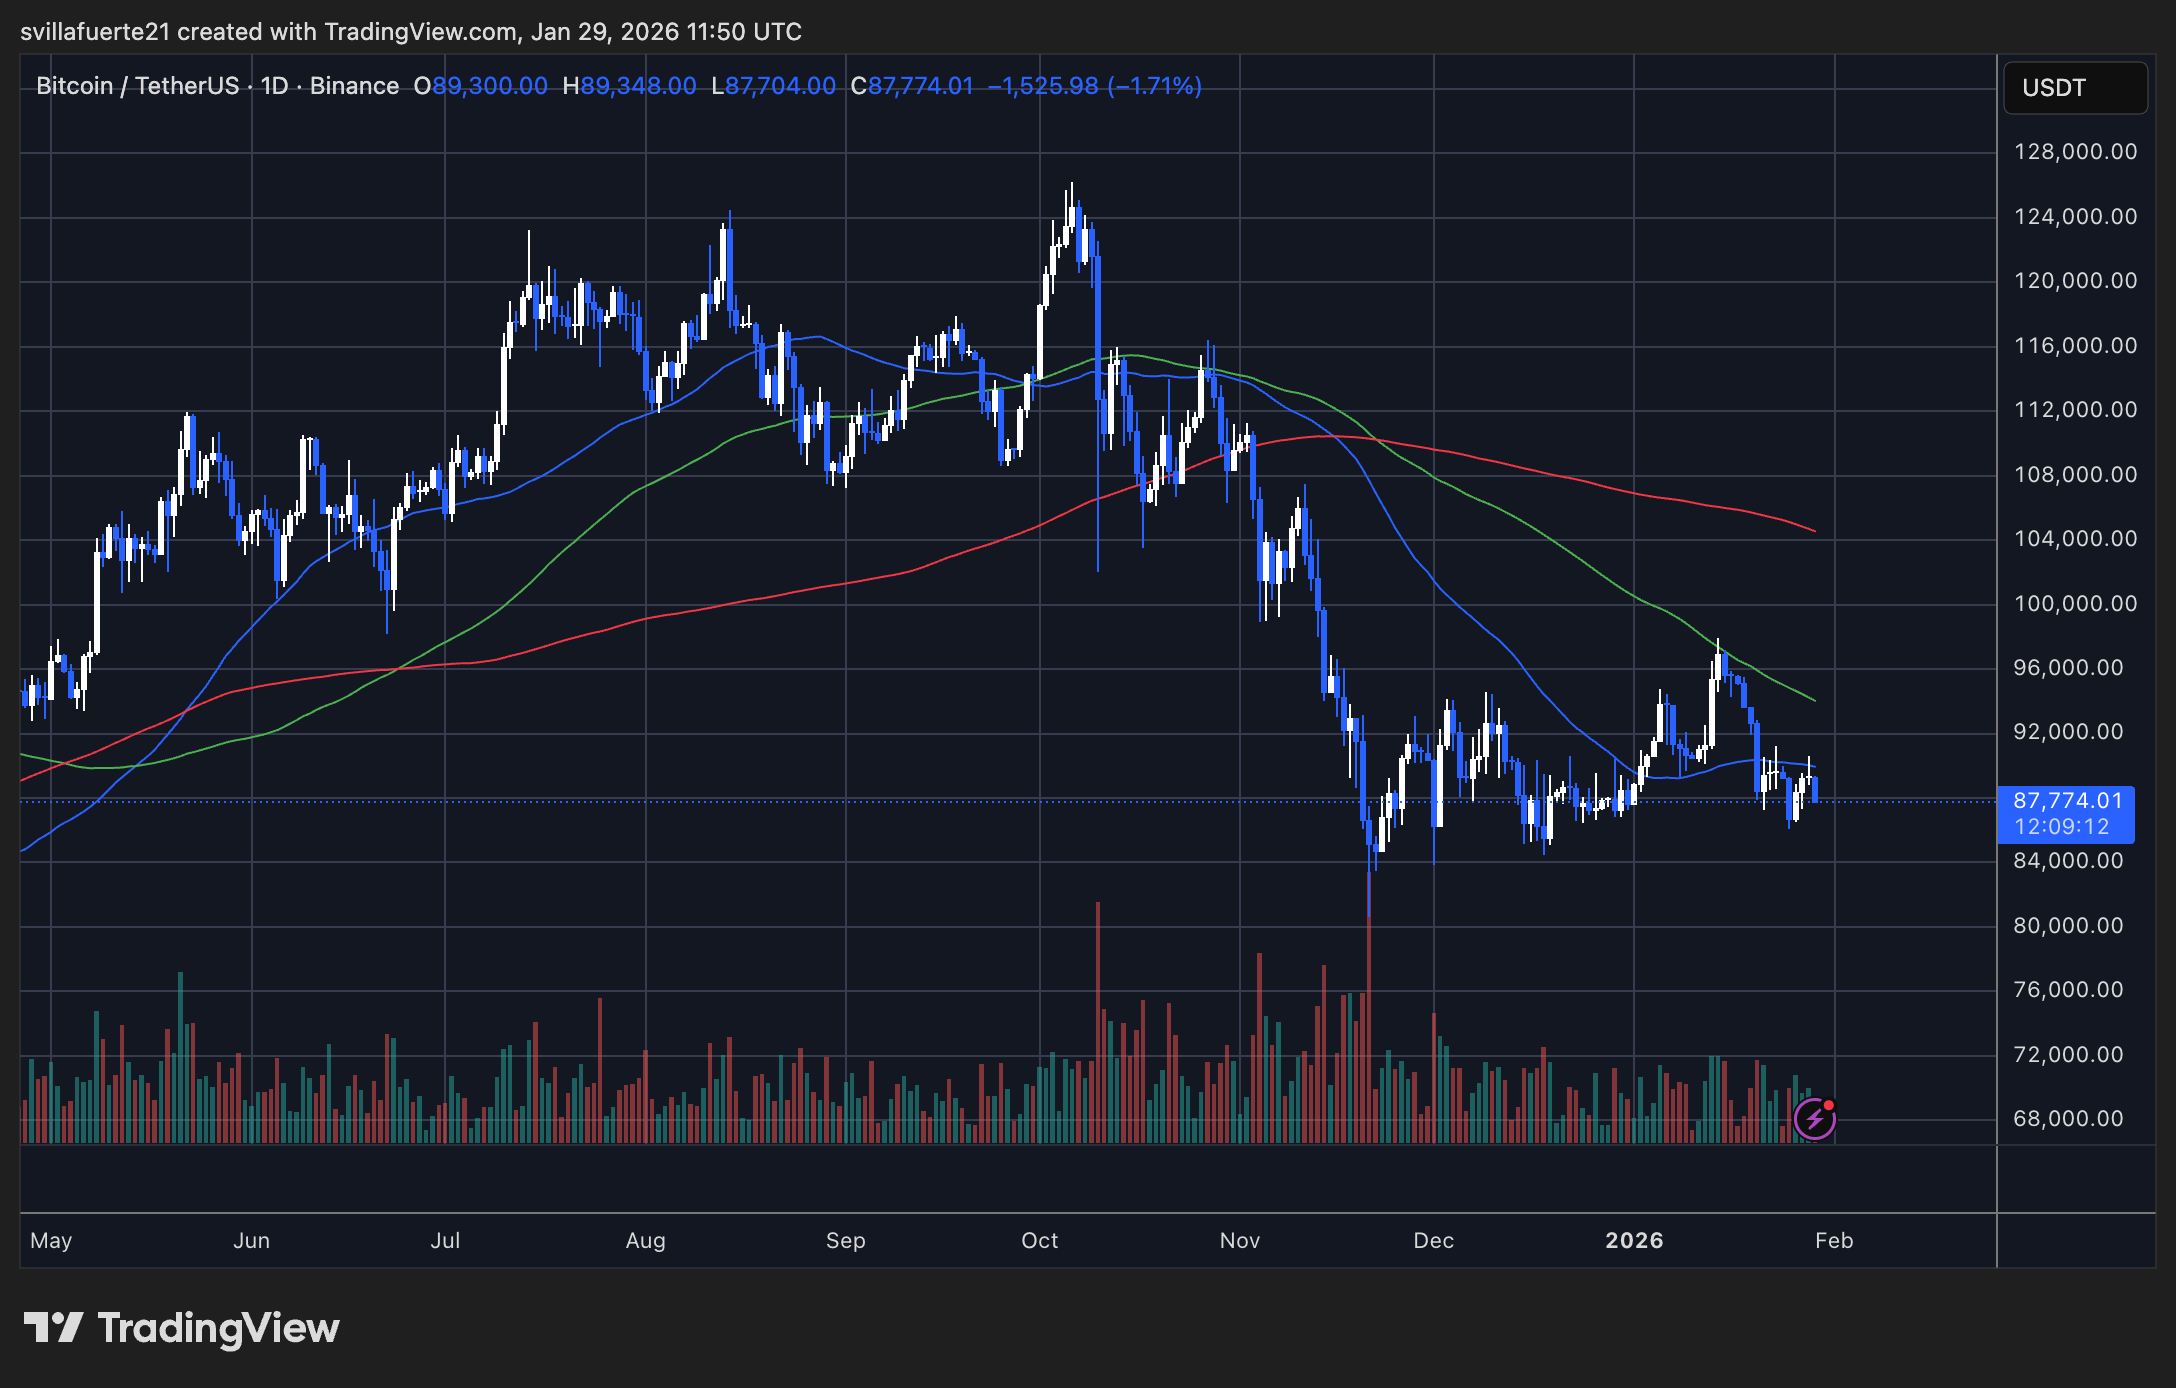
Structurally, the market is locked in a wide range following the sharp breakdown in November. Since then, price action has been characterized by lower highs and choppy rebounds, suggesting reactive buying rather than sustained demand. The recent bounce toward the mid-$90,000s was rejected precisely at the descending moving average cluster, confirming that sellers continue to defend rallies.
Volume behavior supports this interpretation. The largest spikes remain associated with sell-offs, while recovery attempts occur on relatively muted volume, pointing to limited conviction from buyers. This imbalance keeps downside risk active, even as price holds above the December lows.
In the near term, the $86,000–$87,000 area remains a key demand zone. A clean breakdown would expose lower structural supports, while holding this level keeps Bitcoin trapped in a prolonged consolidation. Until BTC reclaims its short- and mid-term averages, the chart favors caution rather than trend reversal.
Featured image from ChatGPT, chart from TradingView.com
Recommended Articles








Comments (0)
Click the $ button, enter the symbol, and select to link a stock, ETF, or other ticker.