


Bitcoin Cash Price Forecast: Retail interest sparks in BCH amid reversal chances



- Bitcoin Cash hovers around $600 following Tuesday’s nearly 4% rise, forming a double bottom reversal pattern.
- Derivatives data shows a spike in BCH Open Interest and positive funding rates reflecting bullish bias among traders.
- The technical outlook for Bitcoin Cash is shifting bullish as the BCH rebound from the 100-day EMA gains traction.
Bitcoin Cash (BCH) is trading around $600 at press time on Wednesday, framing a potential double bottom reversal on the daily chart. The BCH token is witnessing renewed capital inflows into its futures contracts amid a positive funding rate cycle, signaling renewed investor interest. Technically, Bitcoin Cash could rally toward $655 if it sustains momentum.
Retail sentiment is changing for the better
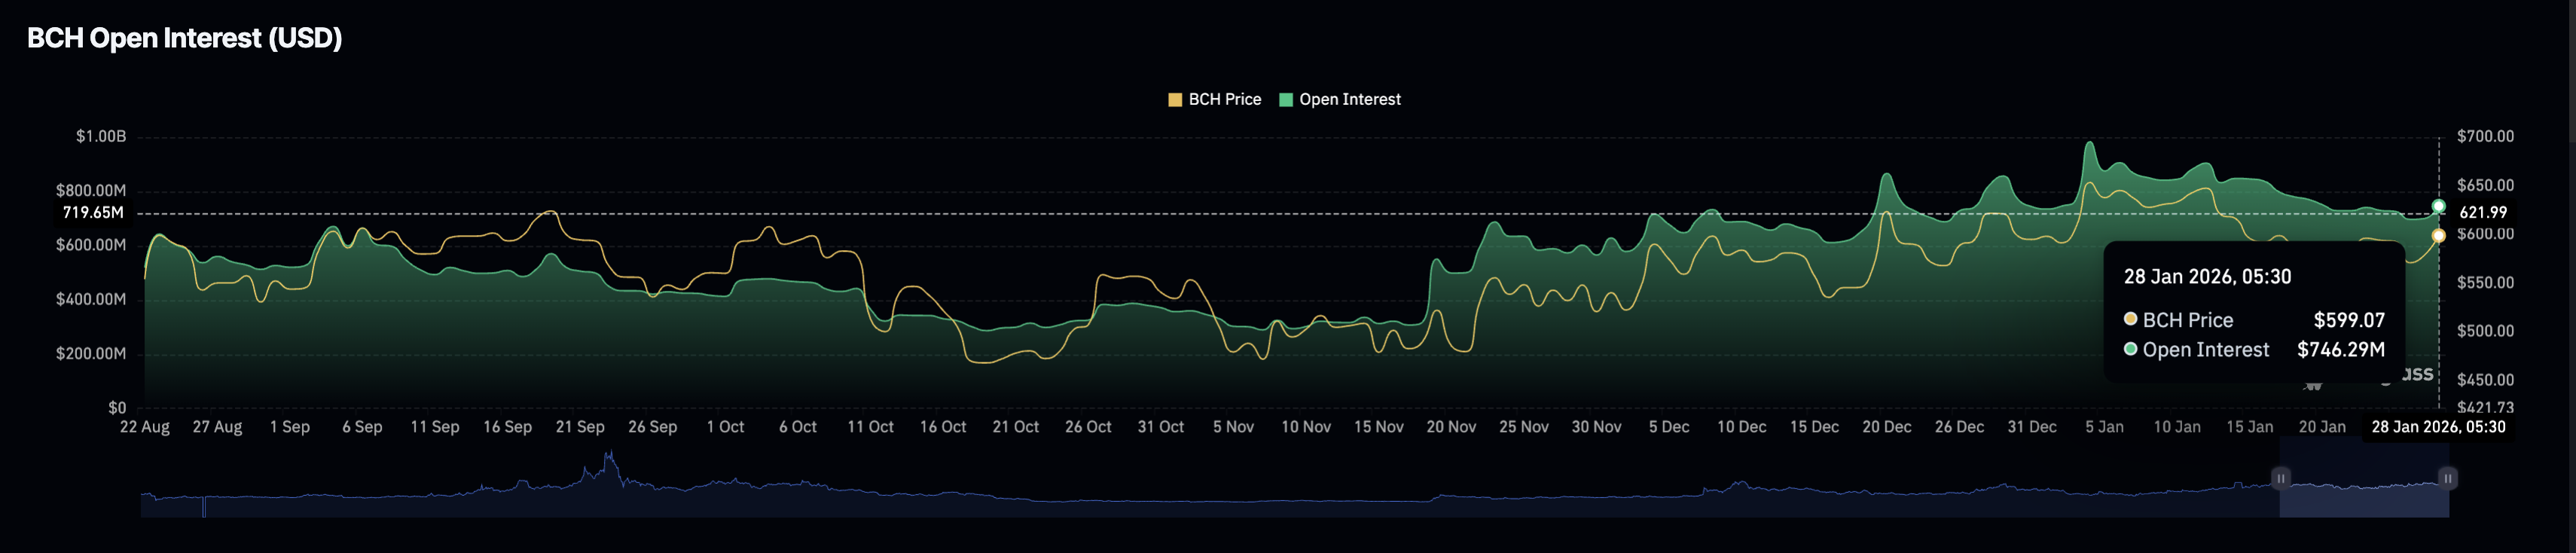
Bitcoin Cash witnesses early signs of retail engagement, aligning with the recovery run seen so far this week. Typically, an alignment of positive funding rates and OI spike signals further upside for an asset. CoinGlass data shows a spike in BCH futures Open Interest (OI) to $746.29 million, up from $700.06 million on Tuesday, indicating increased risk exposure as investors anticipate further gains.
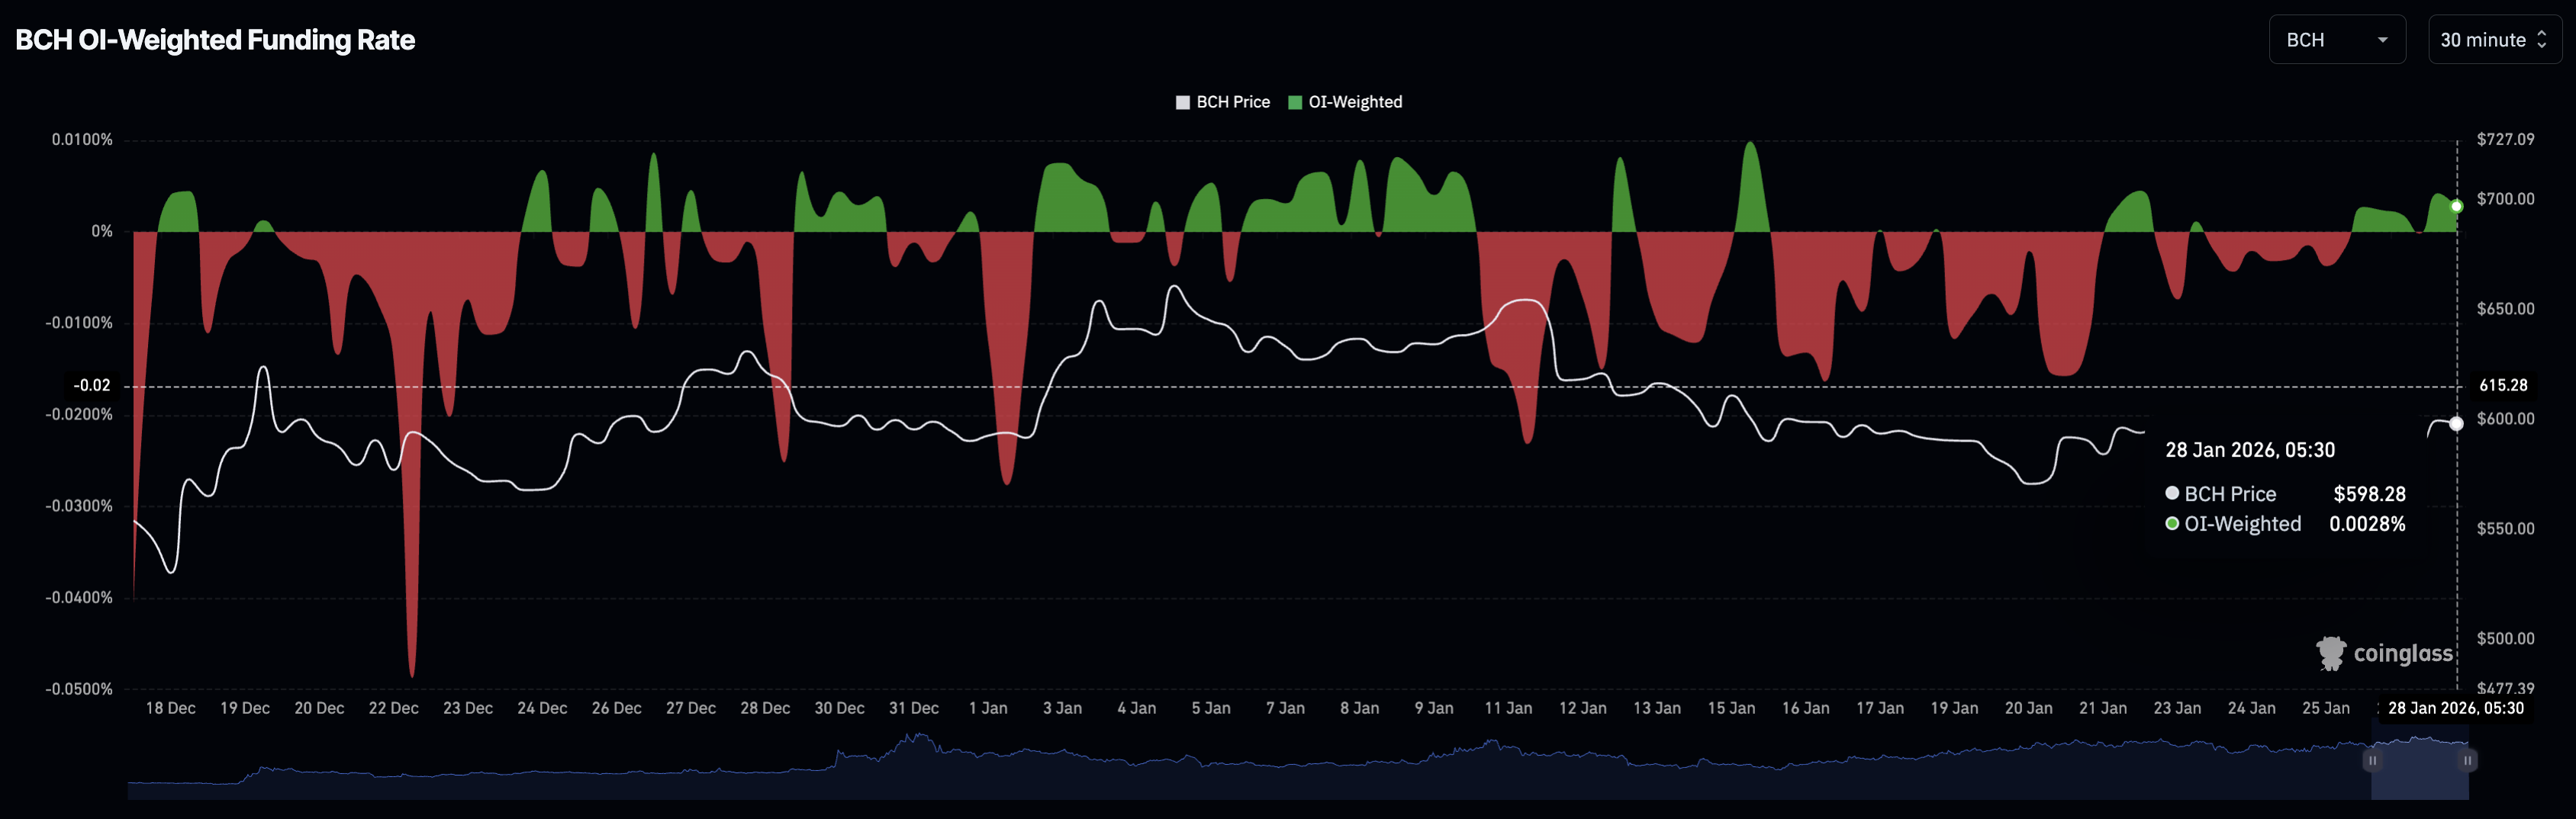
In line with the topside bias, the funding rate remains positive at 0.0028%, indicating a bullish tilt in new positional buildups.
Bitcoin Cash recovery stalls near $600 amid momentum shift
Bitcoin Cash is trading around $600, holding above the 50-day Exponential Moving Average (EMA), which is now above the 100-day and 200-day EMAs, suggesting a long-term uptrend. The rebounds from the 100-day EMA at $575 form a double bottom pattern on the BCH daily price chart with the neckline at the January 16 high of $606.
A decisive close above this level could extend the BCH rally toward the R1 Pivot Point at $655, which previously capped gains in early January.
The technical indicators on the daily chart suggest a decline in selling pressure and flash early signals of a potential bullish trend. The Relative Strength Index (RSI) is at 50, holding at the neutral level after a rebound, indicating reduced selling pressure. At the same time, the Moving Average Convergence Divergence (MACD) reverses higher toward the signal line, potentially leading to a crossover, while negative histograms contract. A rise in the MACD histogram above zero would confirm the crossover and trigger a buy signal.
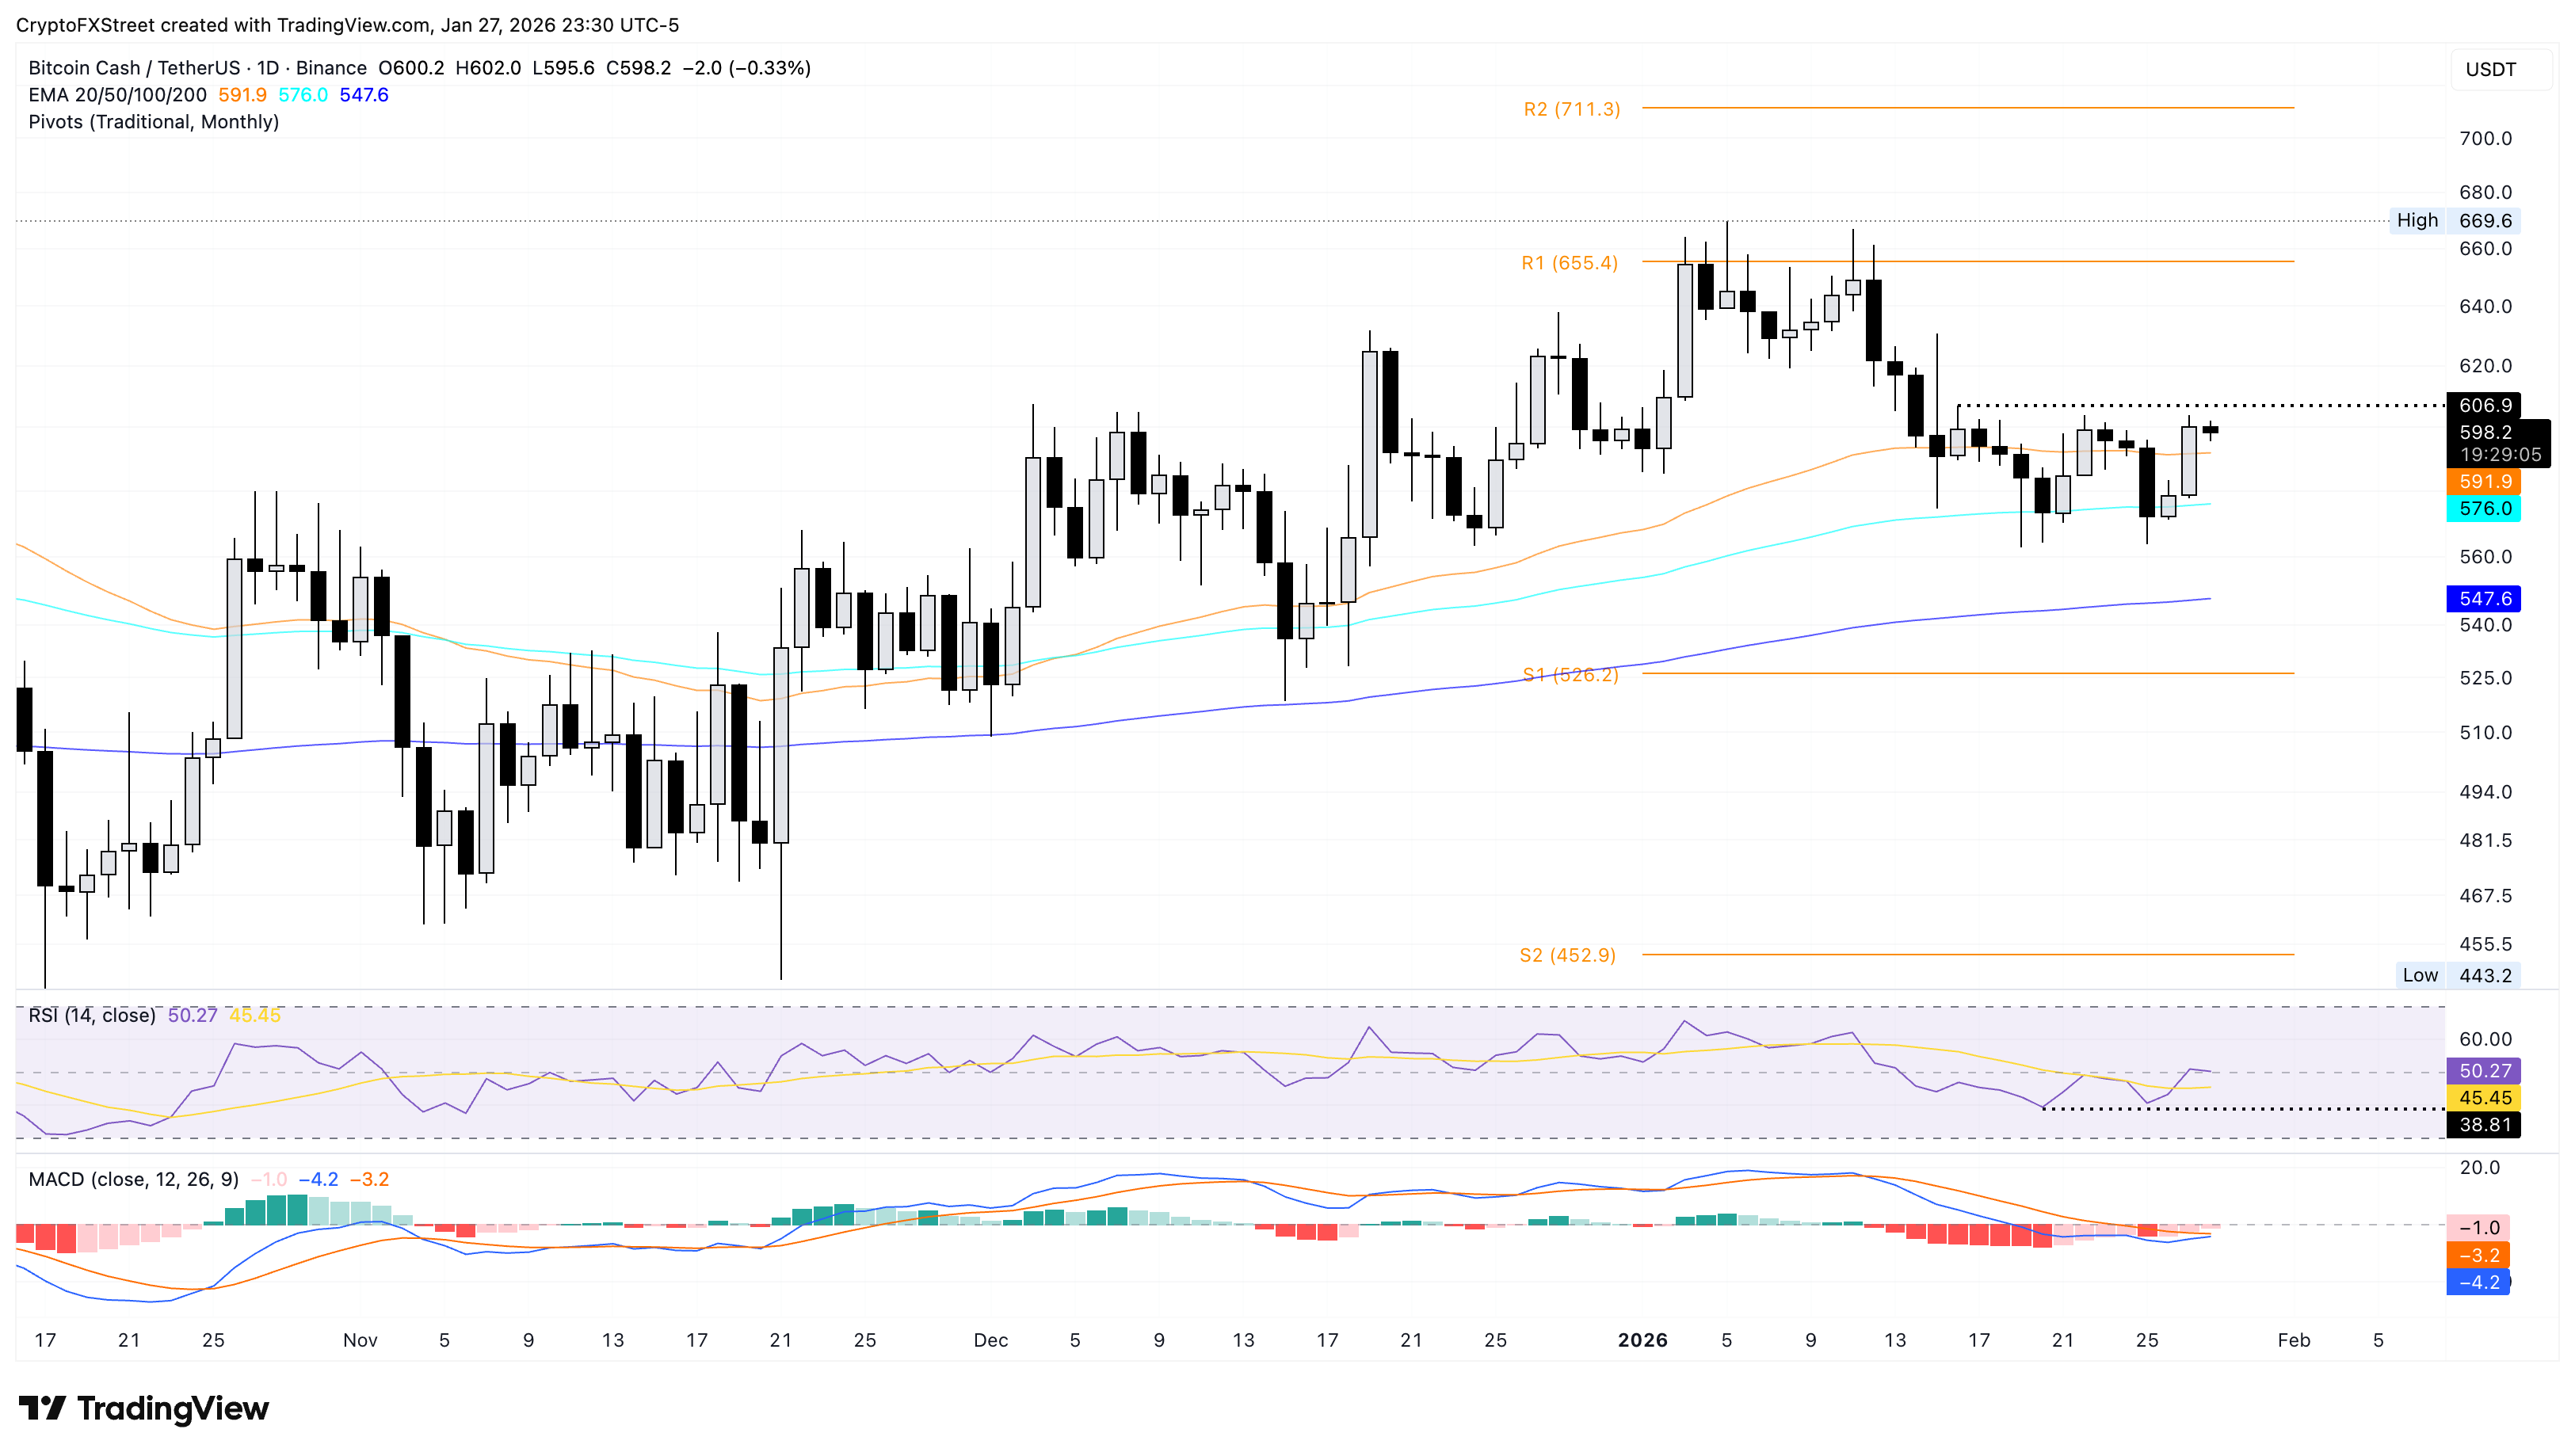
On the downside, if BCH slips below the 100-day EMA at $575, it would extend the decline toward the 200-day EMA at $547.
Recommended Articles







Comments (0)
Click the $ button, enter the symbol, and select to link a stock, ETF, or other ticker.