


Bitcoin Extreme Fear Streak Extends To 16 Days—Longest Since 2022



The Bitcoin Fear & Greed Index has been in the extreme fear territory for two weeks now, showcasing the effect of the crash on investor sentiment.
Bitcoin Fear & Greed Index Is Still Inside Extreme Fear Zone
The “Fear & Greed Index” refers to an indicator created by Alternative that tells us about the average sentiment present among traders in the Bitcoin and wider cryptocurrency markets.
The index uses the data of these five factors to determine the investor mentality: trading volume, market cap dominance, volatility, social media sentiment, and Google Trends. It then represents it using a numeric scale that runs from zero to hundred.
All values above 53 on this scale correspond to a net sentiment of greed. Similarly, those below 47 imply that the investors are fearful. The levels lying between the cutoffs correspond to a neutral mentality.
Besides these three main zones, there are also two “extreme” regions called the extreme fear (below 25) and extreme greed (above 75). The market has been in the former of the two territories lately.
The extremely fearful sentiment is a result of the market crash that Bitcoin and other digital assets have gone through in November. The hit on the investor mentality has been so hard that the index has remained inside this zone for 16 days now, as the below chart shows.
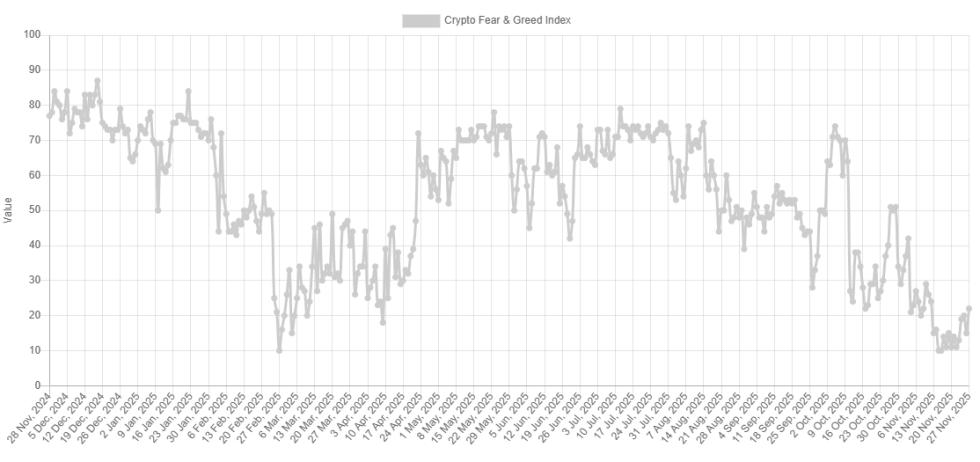
The last time that the Bitcoin Fear & Greed Index saw such a long streak of extreme fear was way back during the 2022 bear market. It’s hard to say how long the streak will extend, however, as BTC has enjoyed a rebound during the past couple of days, with its price returning back above $91,000.
The index has already been on the way up as its latest value is 22, nearing the boundary of the extreme fear zone.
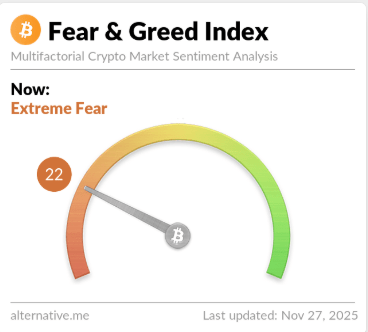
Considering this trend, the Bitcoin Fear & Greed Index may be able to escape the extreme fear zone if the cryptocurrency’s recovery continues in the coming days.
As for what the latest streak of extreme fear sentiment could mean for the asset, history may hold the answer. Often, BTC and other digital assets have tended to move in the direction that goes contrary to crowd expectations. This means that investors being overly bullish can result in tops, while an excess of pessimism can lead to a bottom.
The recent rebound in the Bitcoin price could be this contrarian signal once again playing out for the sector. Naturally, the longer investor excitement toward the rally stays subdued, the better may be its chances of being sustainable.
BTC Price
At the time of writing, Bitcoin is floating around $91,600, up more than 6% over the last week.
Recommended Articles









Comments (0)
Click the $ button, enter the symbol, and select to link a stock, ETF, or other ticker.