


Short-Term Holders Log Biggest Realised Losses in Bitcoin History – Over $900M per Day



Bitcoin is struggling to find support as selling pressure accelerates and uncertainty spreads across the crypto market. After hitting its all-time high near $126,000 in early October, BTC has now lost more than 35% of its value, shaking investor confidence and fueling growing calls that the current bull cycle has ended. Market sentiment has shifted rapidly, with traders, analysts, and long-term participants reassessing expectations as price volatility intensifies and liquidity thins across major exchanges.
What makes the current phase even more concerning is the behavior of short-term holders, who historically act as the most reactive segment of the market. According to key data shared by On-Chain Mind, short-term holders are now locking in the biggest realized losses in Bitcoin’s entire history. This level of loss realization surpasses the capitulation seen during the China mining ban, the FTX collapse, and even the COVID crash, marking an extreme phase of market distress.
This unprecedented level of capitulation suggests that panic has taken control, with newer entrants exiting positions at steep losses. While some analysts argue that such events have historically preceded major reversals, others believe it signals the beginning of a prolonged downtrend. The coming days may determine which narrative takes hold.
Short-Term Holders Face Record Losses as Market Capitulates
On-Chain Mind reports that short-term holders are locking in more than $900 million in losses per day. This extreme level of loss realization reflects a phase of true capitulation.
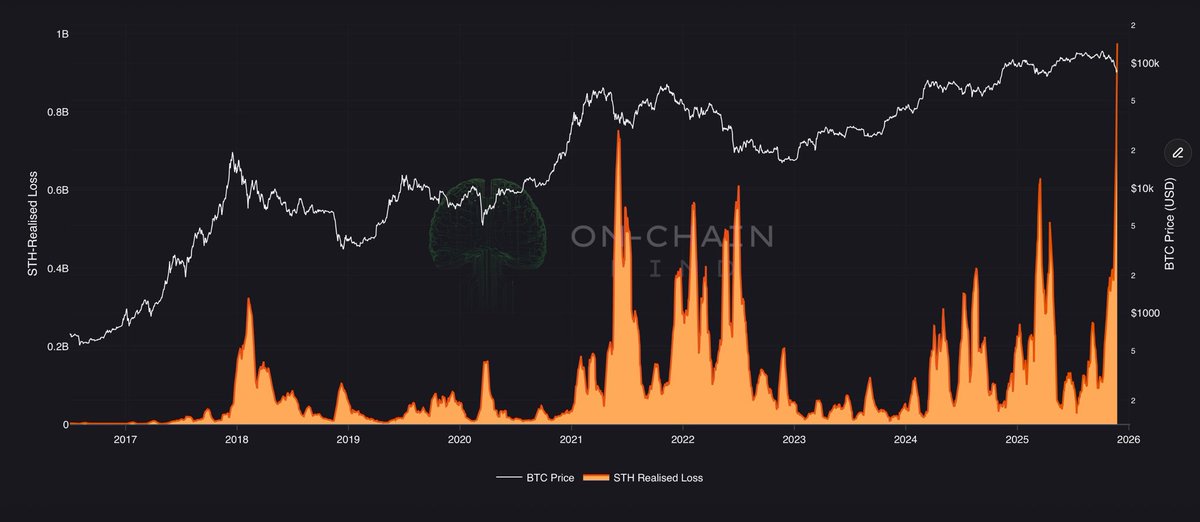
Short-term holders are historically the most sensitive to sharp price swings, and when they begin exiting at such magnitude, it often signals a breaking point in market sentiment. The data suggests that panic selling has reached levels never seen before, even when compared to major historical shock events.
During the COVID crash, the China mining ban, and the FTX implosion, realized losses spiked sharply, yet none of those events reached the current scale. This places the present correction in a category of its own and raises questions about the structural stability of the market over the coming weeks. Some analysts argue that this marks the definitive beginning of a bear cycle, where confidence erodes and capital rotates out of risk assets.
However, there remains a smaller group of optimistic voices who note that extreme capitulation has often preceded powerful recoveries. If Bitcoin stabilizes and buyers return, this could form a major macro bottom. The next move will likely define the market’s trajectory.
BTC Tests Weekly Support After Sharp Reversal
Bitcoin’s weekly chart shows a steep reversal from the all-time high near $126,000, with price now trading around $86,900 after a rapid decline. The drawdown has positioned BTC back toward the key 100-week moving average, which is currently sitting just above $83,000 and acting as an important structural support level.
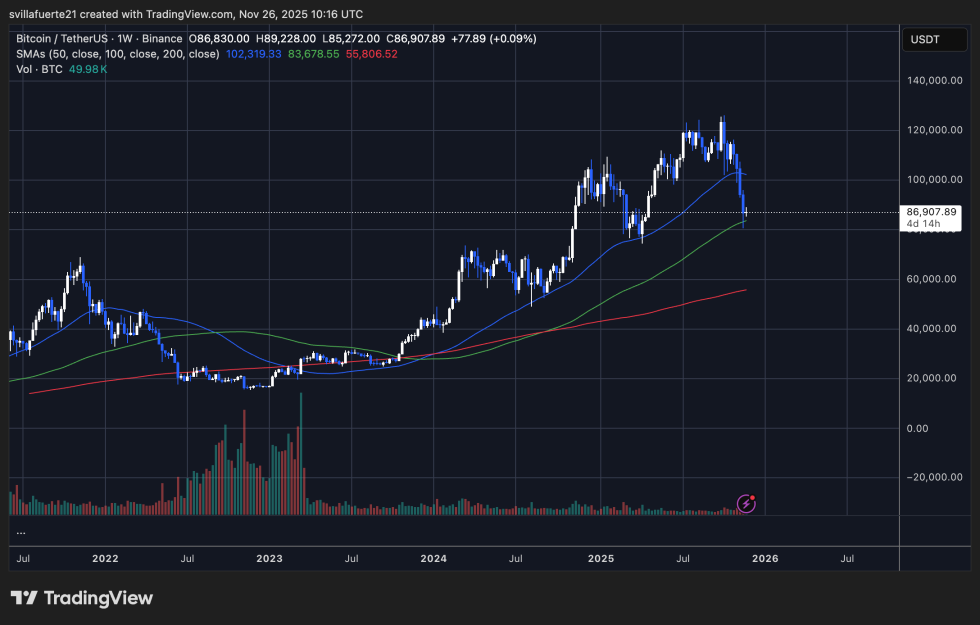
Historically, this moving average has defined the boundary between bull-phase retracements and full macro trend breakdowns. A clean weekly close below it would strengthen the bear-market narrative that many analysts are now beginning to promote.
Despite the severity of the decline, price is beginning to stabilize, forming a small reaction wick suggesting early attempts at demand absorption around the $80,000–$85,000 zone. This region coincides with prior consolidation from early in the cycle, making it a logical area for buyers to defend.
However, momentum indicators remain pointed downward, and the distance from the 50-week moving average highlights the loss of trend strength.
For the bullish case to re-emerge, Bitcoin would need to reclaim the $95,000–$100,000 band, where broken support now acts as resistance. Until then, uncertainty remains elevated, and the weekly structure leans cautiously bearish.
Featured image from ChatGPT, chart from TradingView.com
Recommended Articles









Comments (0)
Click the $ button, enter the symbol, and select to link a stock, ETF, or other ticker.