


Polkadot Break Above $2.85 Ahead? Reversal Setup Forms Beneath Heavy Resistance



Polkadot’s price action is beginning to hint at a possible shift in momentum, with a reversal setup forming just below the critical $2.85 level. The bulls are gradually building pressure, eyeing a breakout that could confirm a change in trend. Still, the presence of strong resistance overhead means the coming sessions will be crucial in determining whether DOT can break free or face another rejection.
DOT’s Downtrend Shows Signs Of Exhaustion As Buyers Eye A Short-Term Recovery
Giving a follow-up on the expected path of DOT in the 4-hour timeframe, Elliott Waves Academy revealed that the series of declines through the sub-waves of the recent impulsive move may be nearing its end. This suggests that the current downward trend is exhausting itself, at least in the short term, with a potential recovery ahead.
Related Reading: Polkadot Recovery Stalls As Bearish Pressure Returns With $3.5 In Sight
Elliott Waves Academy observes that a diagonal pattern appears to be forming, which is outlining the intricate details of wave (1)/(A). This diagonal formation is key to the analysis, as it typically signals the termination of a prior trend and precedes a reversal.
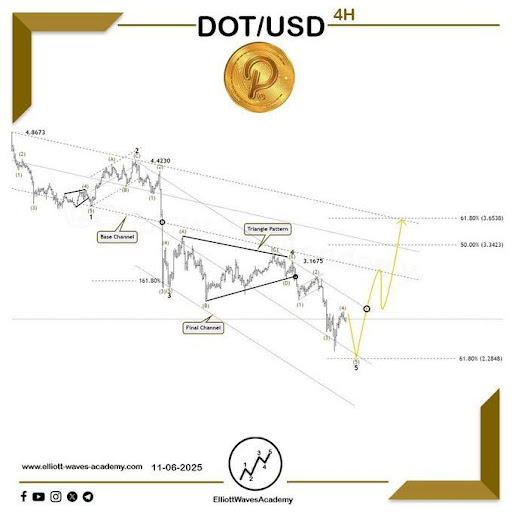
The analyst points to a confirmed break above the upper boundary of this diagonal pattern. Such a break would officially open the path for an upward recovery toward the zone between $3.3423 and $3.36538.
On the other hand, the $2.2848 level is deemed crucial for maintaining the immediate recovery outlook. Elliott Waves Academy warned that if this critical $2.2848 level is broken, further significant downside is expected through an extension of the existing bearish waves.
Polkadot Remains Trapped Beneath Major HTF Resistance Levels
Crypto_Jobs shared on X that the long-term chart for Polkadot remains largely stagnant and constrained beneath major high-timeframe (HTF) resistance zones at $3.200 and $3.780. The analyst cautioned traders to remain conservative with any swing (long) setups while the price trades below these critical resistance barriers.
Examining the current price action, Crypto_Jobs described market conditions as neutral, with Polkadot fluctuating within a tight range between $2.500 and $2.700. The sideways movement reflects a lack of clear direction, as both bulls and bears struggle for dominance. Despite this period of indecision, the chart showcases an emerging pattern that could soon dictate the next significant move.
The crypto analyst noted the possible formation of an inverse head and shoulders pattern, with a neckline around the $2.700–$2.850 to $3.00 zone. A confirmed breakout above this neckline could signal renewed bullish momentum, potentially leading to a 5–10% price surge.
Recommended Articles









Comments (0)
Click the $ button, enter the symbol, and select to link a stock, ETF, or other ticker.