

XLM Soars Over 14%, Hits Two-Month High

TradingKeyJul 10, 2025 3:49 AM
View all comments(0)
TradingKey – On Thursday, July 10, Stellar Lumens (XLM) extended its rally, jumping 14.3% intraday to a high of $0.297, marking its strongest performance since May.
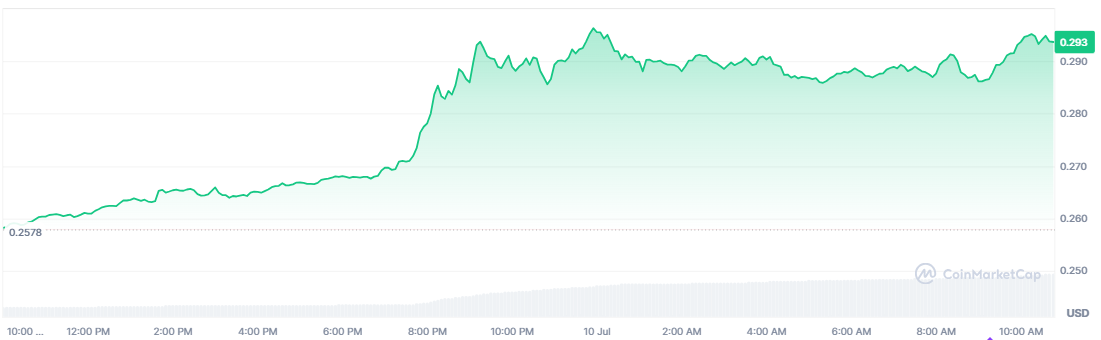
XLM Price Chart – Source: CoinMarketCap.
The surge was driven by two key factors:
- A broader bullish sentiment across the crypto market, and
- The release of Stellar Core v23.0.0rc2, which enhances the network’s scalability and maturity.
Earlier this month, XLM had dipped to a local low of $0.22, but has since rebounded steadily. It now trades above the midpoint of its $0.22–$0.34 consolidation range, with roughly 14% upside remaining before testing the upper boundary.
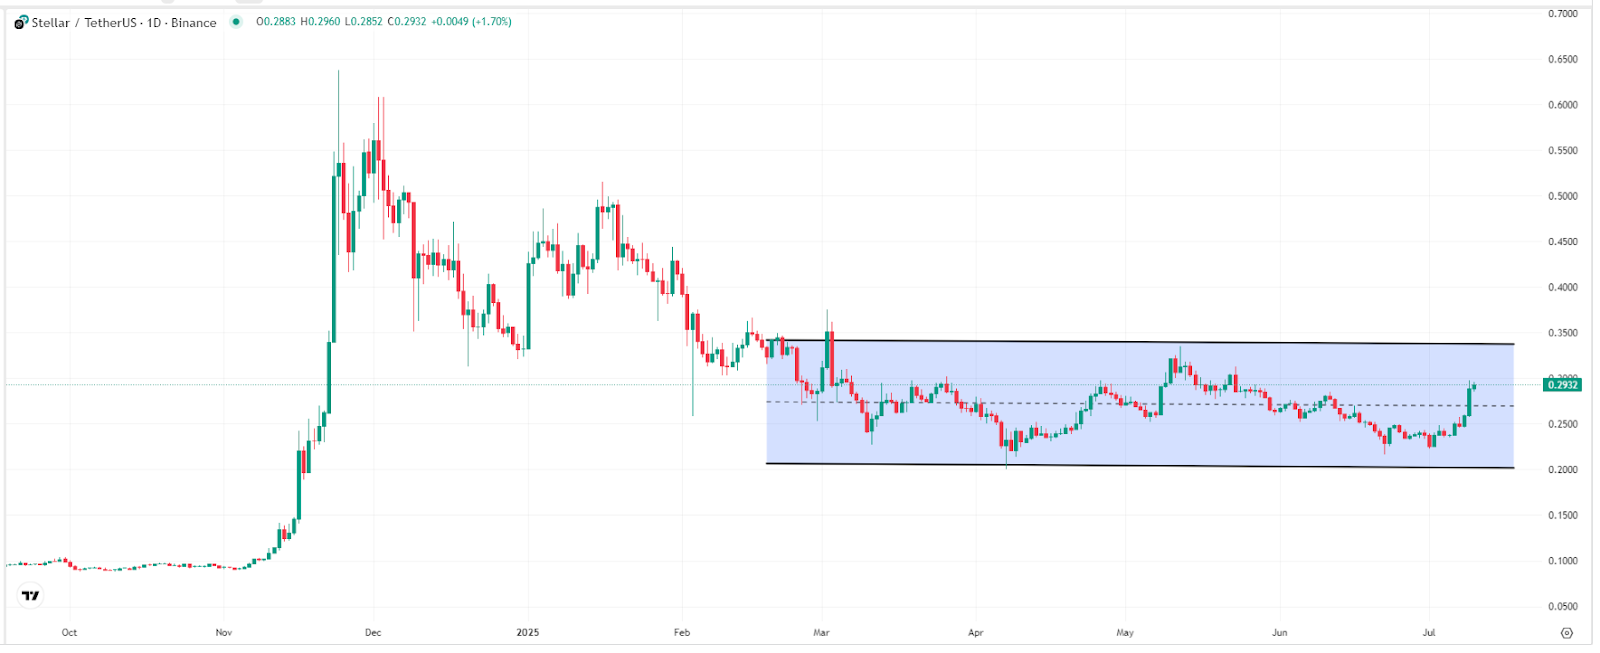
XLM Price Chart – Source: TradingView.
A potential breakout above $0.34 may hinge on a major catalyst: approval of altcoin spot ETFs. If approved, capital could rotate from Bitcoin into altcoins, lifting the entire sector — and XLM would likely be a key beneficiary.
Disclaimer: The information provided on this website is for educational and informational purposes only and should not be considered financial or investment advice.
Like
Recommended Articles

Featured Tools


Top News

Google Q2 Cloud Revenue Surges 82%: Net Profit Soars 298% YoY, 26% QoQ Capital Expenditure Growth Sparks Sharp Bull-Bear Divide

SpaceX Shares Fall Over 5% to Hit New All-Time Low: Plans New Data Center in Texas, Morgan Stanley Warns xAI Capex May Reach $120 Billion
Western Digital (WDC) Surges 12.5% to $548 - Kioxia Merger Talks, $900 Analyst Target
Intel (INTC) Q2 2026 Earnings: What the Results Mean for the Stock
Alphabet Q2 Earnings Preview: $190 Billion AI Gamble Faces Major Test, Can Google Cloud Still Sustain the Growth Myth?

Comments (0)
Click the $ button, enter the symbol, and select to link a stock, ETF, or other ticker.