


Ethereum Forming A Symmetrical Pattern – Key Resistance At $4,100



Ethereum is making another attempt to break above the $4,000 level as it edges closer to its all-time highs. Despite its strong fundamentals, doubts linger in the market regarding Ethereum’s performance this cycle, with some expecting it to underperform amid stiff competition from other blockchain ecosystems. However, Ethereum’s recent price action suggests that it is building momentum, keeping investors on edge for a potential breakout.
Top analyst Carl Runefelt recently shared a technical analysis, noting that Ethereum has encountered strong resistance near the $4,000 mark and is now consolidating within a symmetrical triangle on the hourly chart. This pattern often precedes a decisive move, leaving traders speculating whether ETH will break out to new highs or face a temporary pullback.
Ethereum’s performance at this key level will likely shape market sentiment in the coming weeks. A breakout above $4,000 could pave the way for a rally toward its all-time high, reigniting investor confidence. On the other hand, failure to clear this resistance might validate bearish concerns and lead to a retrace. As ETH remains at a critical juncture, all eyes are on its ability to navigate this pivotal zone and deliver the next major move.
Ethereum Preparing To Move
Ethereum has been grappling with significant resistance above the $4,100 level, leaving the market in suspense as traders anticipate its next move. With the price consolidating and showing signs of tension, Ethereum appears ready to make a decisive move in the coming days. The critical question remains: will it break higher, or is a pullback imminent?
Runefelt shared his insights on X, pointing out that Ethereum is currently trading within a symmetrical triangle on the hourly chart—a pattern known for signaling potential breakouts or breakdowns. According to Runefelt, Ethereum’s immediate future hinges on two key levels.
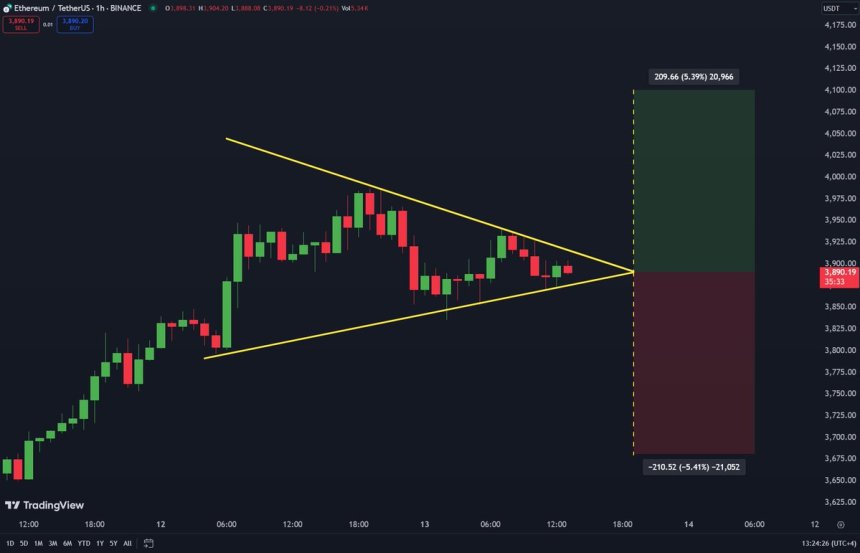
A breakout above $4,100 would confirm a bullish trajectory, likely propelling ETH toward new highs. Conversely, a breakdown below $3,675 would signal bearish sentiment, opening the door for a deeper correction.
Runefelt emphasizes the importance of these levels, noting that the symmetrical triangle suggests mounting pressure that could soon lead to significant volatility. As Ethereum holds its position near critical resistance, the next few days are shaping up to be pivotal for determining its market direction.
Technical Levels To Watch
Ethereum (ETH) is currently trading at $3,840 after failing to break above the critical $4,000 resistance level. While the price remains strong and within range of this key level, it needs to clear $4,000 to confirm the continuation of its uptrend. Without a decisive breakout, ETH risks losing momentum, leaving traders and investors cautious about the next move.
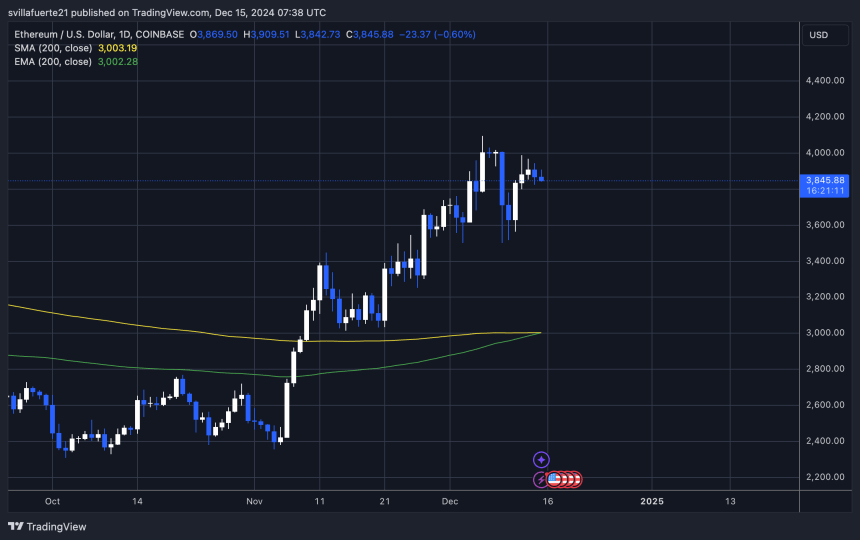
The $4,000 level has proven to be a significant psychological and technical barrier for Ethereum, with multiple attempts to break it being met with selling pressure. A successful breach of this resistance would likely pave the way for ETH to target higher levels, potentially pushing toward the yearly high of $4,100 and beyond.
However, if Ethereum fails to overcome this hurdle, the market could see a retrace to lower demand zones. The $3,500 area is emerging as a critical support level that traders are closely monitoring. A dip to this level could provide a strong foundation for a bounce, but losing this support might signal a shift toward bearish sentiment.
Featured image from Dall-E, chart from TradingView
Recommended Articles









Comments (0)
Click the $ button, enter the symbol, and select to link a stock, ETF, or other ticker.