


 Discount


S&P 500 Falls Below 200-Day Moving Average: Buy-the-Dip Opportunity or Bear Market Warning?



AI Podcast


The S&P 500 has fallen below its 200-day moving average, joining major indexes in signaling a weakening medium-to-long-term trend as the AI stock selloff broadens across all sectors. While historical data suggests that a breach of this moving average alone does not confirm a bear market, current downside risks depend heavily on macroeconomic factors, corporate earnings, and whether the index can reclaim critical resistance levels near 7,346. Investors should closely monitor key fundamentals, including treasury yields and credit market stress, to determine if this technical correction will evolve into a deeper downturn.

TradingKey - The S&P 500 fell below its closely watched 200-day moving average, joining the Dow Jones Industrial Average, the Nasdaq Composite Index, and small- and mid-cap stock indexes in signaling a weakening long-term trend. As the AI trade continues to cool, market selling pressure is no longer confined to tech stocks such as Nvidia, but has begun spreading to broader sectors.
The S&P 500 has fallen more than 4% since the start of the fourth quarter, while the information technology sector has dropped over 15% during the same period. According to Dow Jones Market Data, this also marks the first time the S&P 500 has closed below its 200-day moving average since April 7, 2025. Technical analysis typically views a break below the 200-day moving average as a sign of a weakening medium-to-long-term trend, though this indicator alone cannot confirm a bear market.
S&P 500 Falls Below 200-Day Moving Average as AI Stock Selloff Spreads to Entire Market
This round of correction was initially concentrated in the semiconductor and AI infrastructure sectors. Given the heavy weighting of Nvidia and other large-cap tech companies in the S&P 500, pullbacks in these stocks have exerted a significant drag on the index. However, recent price action indicates that the market is shifting from an internal adjustment within tech stocks toward a broader reduction in risk exposure.
On Tuesday, all S&P 500 sectors declined, signaling that investors were not simply rotating from high-valuation tech stocks into defensive sectors, but rather reducing equity exposure across the board. Cyclical and defensive sectors, which had previously been relatively resilient, also began to come under pressure, reflecting declining market risk appetite.
Meanwhile, the Russell 2000 Index and the S&P MidCap 400 Index broke below their respective 200-day moving averages as early as October, and the Nasdaq Composite Index subsequently lost this level as well. With the S&P 500 and the Dow now joining the breakdown, it indicates that technical weakness has spread from small- and mid-cap stocks to large-cap blue chips.
The 200-day moving average reflects an index's average trading cost over approximately the past ten months. When the market trades above the moving average for an extended period, it typically indicates that the medium-term trend is still dominated by buyers. Once it is breached, however, some trend-following funds may scale back their risk exposure, and investors who bought earlier are more likely to sell into rallies.
Is the S&P 500 Now a Buying Opportunity or the Start of a Bear Market?
Historical data does not support investors concluding that a bear market has arrived solely based on a break below the 200-day moving average.
Studies show that out of 19 similar instances since 1982, in only three cases had the S&P 500 already entered a bear market with a decline of over 20%. The one-year average and median returns across the sample remained in double digits, indicating that an initial break below the 200-day moving average reflects heightened volatility rather than a sufficient condition for a confirmed bear market.
This phenomenon is not difficult to understand. When an index breaks below its long-term moving average, the market has typically already priced in some negative factors, and valuations have retreated from their peaks. Concentrated selling from stop-loss orders and trend-following funds may amplify declines in the short term, but if corporate earnings and the economic environment do not worsen further, corrected prices may instead attract medium- and long-term capital back into the market.
However, historical averages cannot substitute for an assessment of the current environment.
During the 2000 tech bubble, the 2008 financial crisis, and the 2022 rate-hiking cycle, the S&P 500 continued to slide after breaking below the 200-day moving average. When a breakdown coincides with an earnings recession, widening credit spreads, or economic contraction, technical corrections are more likely to evolve into prolonged bear markets.
Therefore, the key short-term focus remains whether the S&P 500 can reclaim the 200-day moving average. If the index quickly recovers above the moving average and stabilizes, it suggests the market can still absorb the selling pressure in AI and tech stocks, and the current range may gradually form an interim bottom. If the index remains below the moving average and fails to break above this level on repeated rebounds, investors must be alert to a deeper correction taking shape.
Investors should also monitor whether tech companies' earnings forecasts are downgraded, whether hyperscalers trim AI capital expenditures, whether U.S. Treasury yields continue to rise, and whether financing stress emerges in the credit market. These fundamental variables are far more decisive than any single technical indicator in determining the market's ultimate direction.
S&P 500 Index Technical Analysis
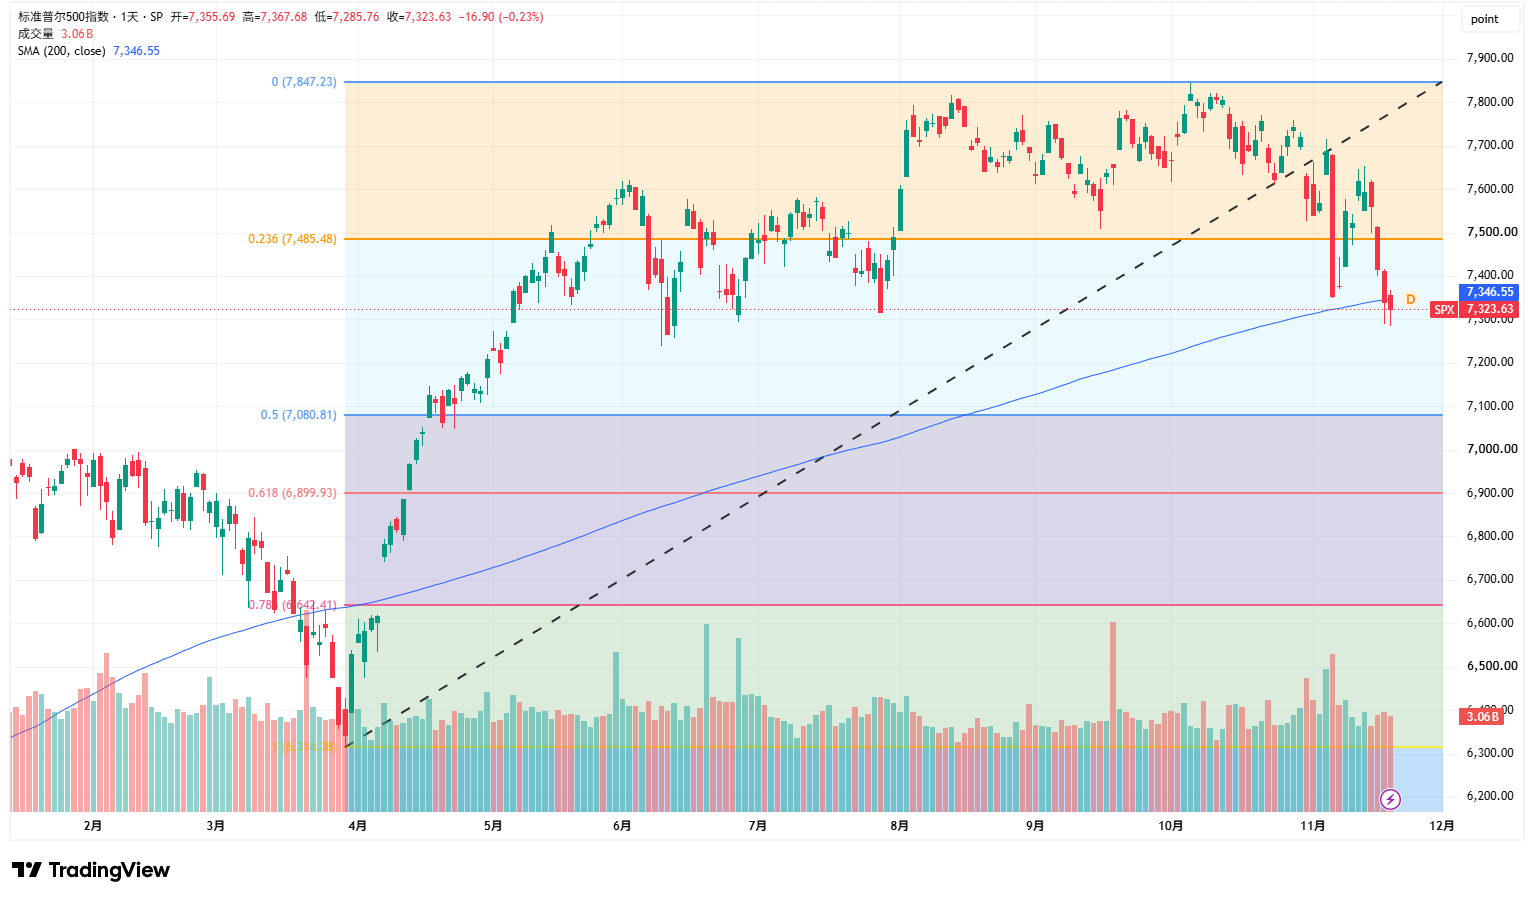
Source: TradingView
From the daily chart, the S&P 500 Index traded below its 200-day moving average for the second consecutive session. On Wednesday, the 200-day moving average stood at 7,346.55. Although the index rebounded intraday to 7,367.68 on Wednesday, it failed to hold above this long-term trendline, indicating that the moving average has shifted from potential support into short-term resistance.
The index not only lost its 200-day moving average, but also broke below the ascending trendline connecting the April lows, while retreating below the key Fibonacci level of 7,485. Recent highs have been steadily declining and rebound momentum has been weakening, signaling that the market structure is shifting from a strong uptrend toward a choppy, downward-leaning stance.
Currently, the 7,285 to 7,300 area warrants the closest attention. On Wednesday, after dipping to a low of 7,285.76, the index saw some buying support, indicating that some capital is still trying to defend the market here. If the index breaks further below 7,285 and fails to quickly reclaim it, downside room could open up further.
To the upside, 7,346 to 7,350 is the initial hurdle the index needs to reclaim. Only by reclaiming the 200-day moving average can short-term selling pressure be relieved. A more critical level for confirming a reversal is near 7,485; if the index can break above and hold that level, it would suggest that the recent breakdown may be a false breakout, offering the market an opportunity to return to its previous upward range.
This content was translated using AI and reviewed for clarity. It is for informational purposes only.
Recommended Articles








Comments (0)
Click the $ button, enter the symbol, and select to link a stock, ETF, or other ticker.