


Seagate Earnings Preview: EPS Expected to Surge 190%, Wall Street Sees Stock as High as $1,600



AI Podcast


Seagate Technology will release its Q1 FY2027 financial report after the U.S. stock market close on Tuesday, October 27, 2026, with an earnings call at 5:00 p.m. Eastern Time. Wall Street anticipates a nearly 190% surge in EPS to approximately $7.30 and revenue of $4.14 billion, driven by AI data storage demand and technological advantages. Top institutional target prices reach up to $1,600, supported by strong free cash flow and long-term agreements. Technistically, the stock is consolidating in the $630–$660 range, facing a critical breakout resistance at the $700 level, with downside support noted at $450.
TradingKey - Global data storage giant Seagate Technology (STX) is scheduled to officially release its financial report for the first quarter of fiscal year 2027 (Q1 FY2027) after the U.S. stock market close on Tuesday, October 27, 2026, and hold an earnings conference call at 5:00 p.m. Eastern Time.
Despite broad market deleveraging pullbacks in the chip and storage sectors over the past month, the public market still holds exceptionally high earnings expansion expectations for Seagate's quarterly report. Wall Street institutions estimate that its earnings per share (EPS) could surge by nearly +190%, with top bullish institutions setting a 12-month target price as high as $1,600.
Seagate EPS Expected to Surge 190%
Supported by strong fundamentals such as technological monopoly and single-disk breakthroughs, explosive demand for massive cold/warm data storage from AI large models, and locked-in profits via long-term agreements (LTAs), the market is optimistic about Seagate's earnings report for this quarter, with details as follows:
Core Financial Metrics | Market Consensus Estimate | Company Official Guidance Range | Prior-Year Period (Q1 FY26) | Year-over-Year (YoY) |
Revenue | $4.14 billion | $4.0 – $4.2 billion | $2.63 billion | YoY +57.5% |
Earnings Per Share (EPS) | $7.30 – $7.42 | Guidance midpoint approx. $7.30 | $2.53 | Expected to surge approx. +188% to +193% |
Notably, Seagate Technology has beaten Wall Street EPS estimates in 100% of the past 8 quarters, and its stock has a 75% probability of rising on the first trading day following earnings releases over the past 3 years, drawing significant attention to this report.
Wall Street's Most Bullish Call Sees Seagate Stock Rising to $1,600
Wall Street institutions have mixed price target forecasts for Seagate Technology, with the current highest target price at $1,600, low conservative target prices ranging from $520.00 to $580, and the average consensus target price around $1,000, detailed as follows:
Investment Institution / Investment Bank | Latest Rating | 12-Month Target Price | Forecast Logic |
Rosenblatt Securities | Buy | $1,400 – $1,600 | HAMR single-disk 3TB+ technology leads competitors by 1.5–2 years; gross margin is surging toward 38–40%+ |
Citi | Buy | $1,300 | AI cloud giants sign long-term contracts to lock in 30TB/32TB capacity, providing extremely high free cash flow visibility |
Barclays | Buy | $1,250 | Smooth ramp-up of HAMR capacity drives strong operating leverage, while cloud customer capex continues to expand. |
JPMorgan | Overweight | $1,240 | Net leverage ratio dropped to a record low of 0.4x Adjusted EBITDA; balance sheet is rapidly de-risking, and abundant cash flow will be used for buybacks and dividends. |
Seagate Stock Technical Analysis: Breaking $700 Is Key
As Seagate's stock price pulled back from its highs alongside the global semiconductor and hardware sectors in late October to deleverage, it is currently trading in the $630.00–$660 range, consolidating and changing hands. Although Wall Street is generally bullish on its stock price, it faces an obstacle at $700 in the short term. This is not merely a psychological round-number level, but a critical make-or-break pivot separating short-term correction bottom-seeking from the resumption of a medium-to-long-term primary bull run.
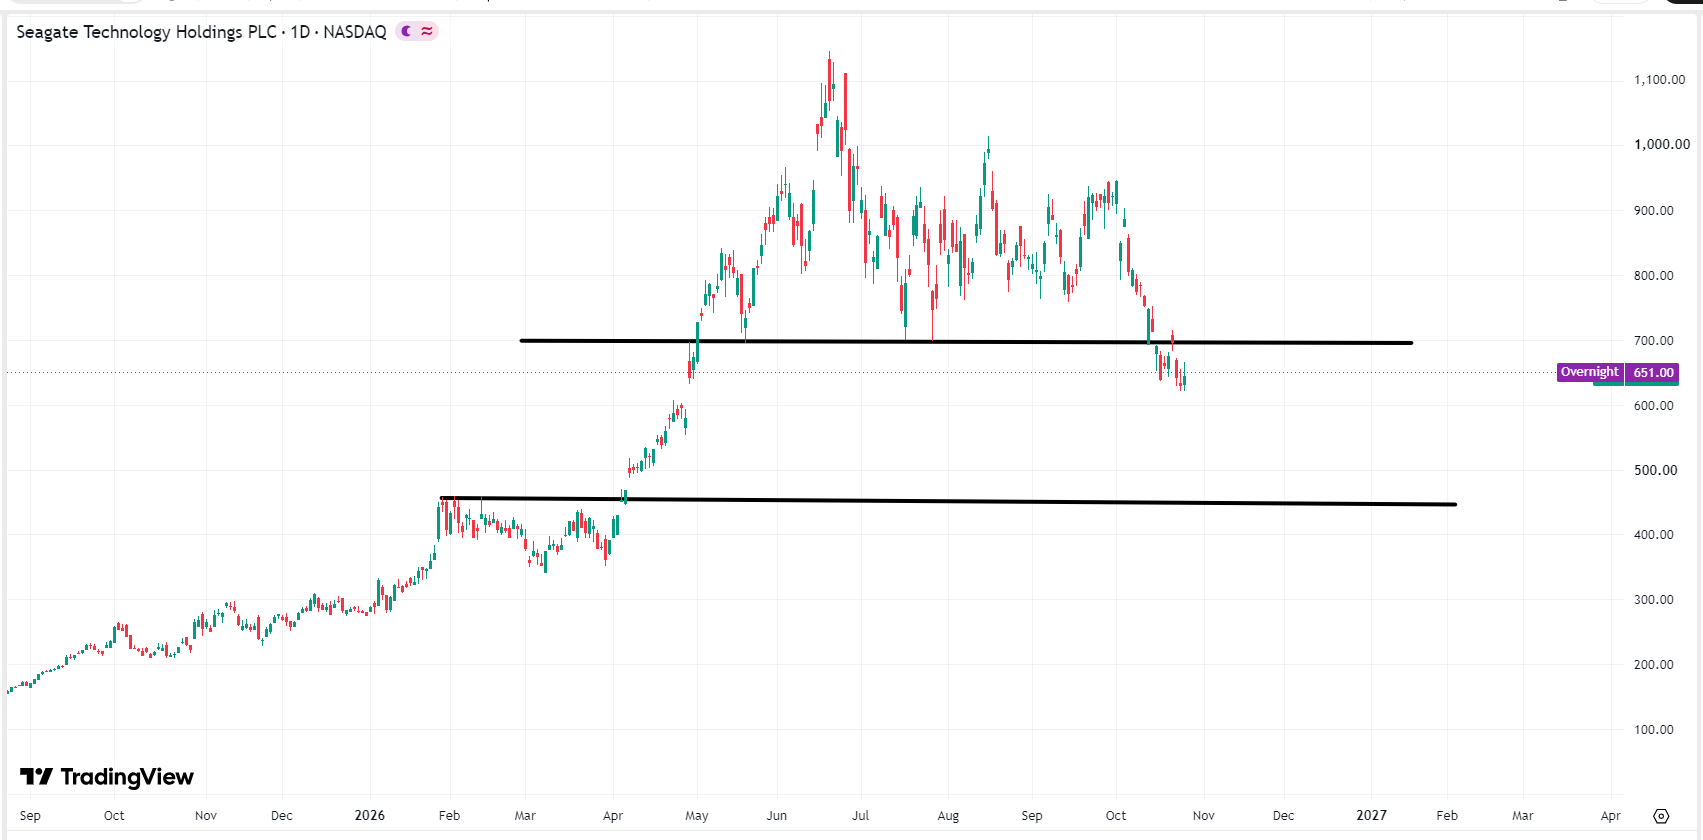 Seagate Technology stock price chart, Source: TradingView
To confirm $700 as a genuine breakout rather than a false spike, technical traders need to closely monitor two key indicators: On the day of breaking above $700, trading volume must reach 1.8 to over 2.5 times the daily average, indicating substantial spot buying by Wall Street institutional players; a solid bullish candlestick must form, closing above $705 and holding above $700 for two consecutive trading days. However, if it fails to reclaim above this level, it may head lower to seek support at $450.
This content was translated using AI and reviewed for clarity. It is for informational purposes only.
Recommended Articles












Comments (0)
Click the $ button, enter the symbol, and select to link a stock, ETF, or other ticker.